Map Settings
The DSPTCH Map contains Map Settings that allows you to choose what information to display on the Map, and how the information is displayed on the Map.
Map Buttons
On the Map Screen, there are three (3) buttons that allow you to change your orientation or the content displayed on the map:
- Compass
- My Location
- Layer Tray
Compass
By default, the Map is oriented Due North, with the cardinal direction North being the top center of the screen. With two fingers, you can rotate the map clockwise or counterclockwise, changing the orientation of True North to a different direction on your screen.
Once True North is no longer at the top center of the screen, the Map Compass will appear. Tap the Map Compass to reset the orientation of the Map, returning True North to the top center of the screen.
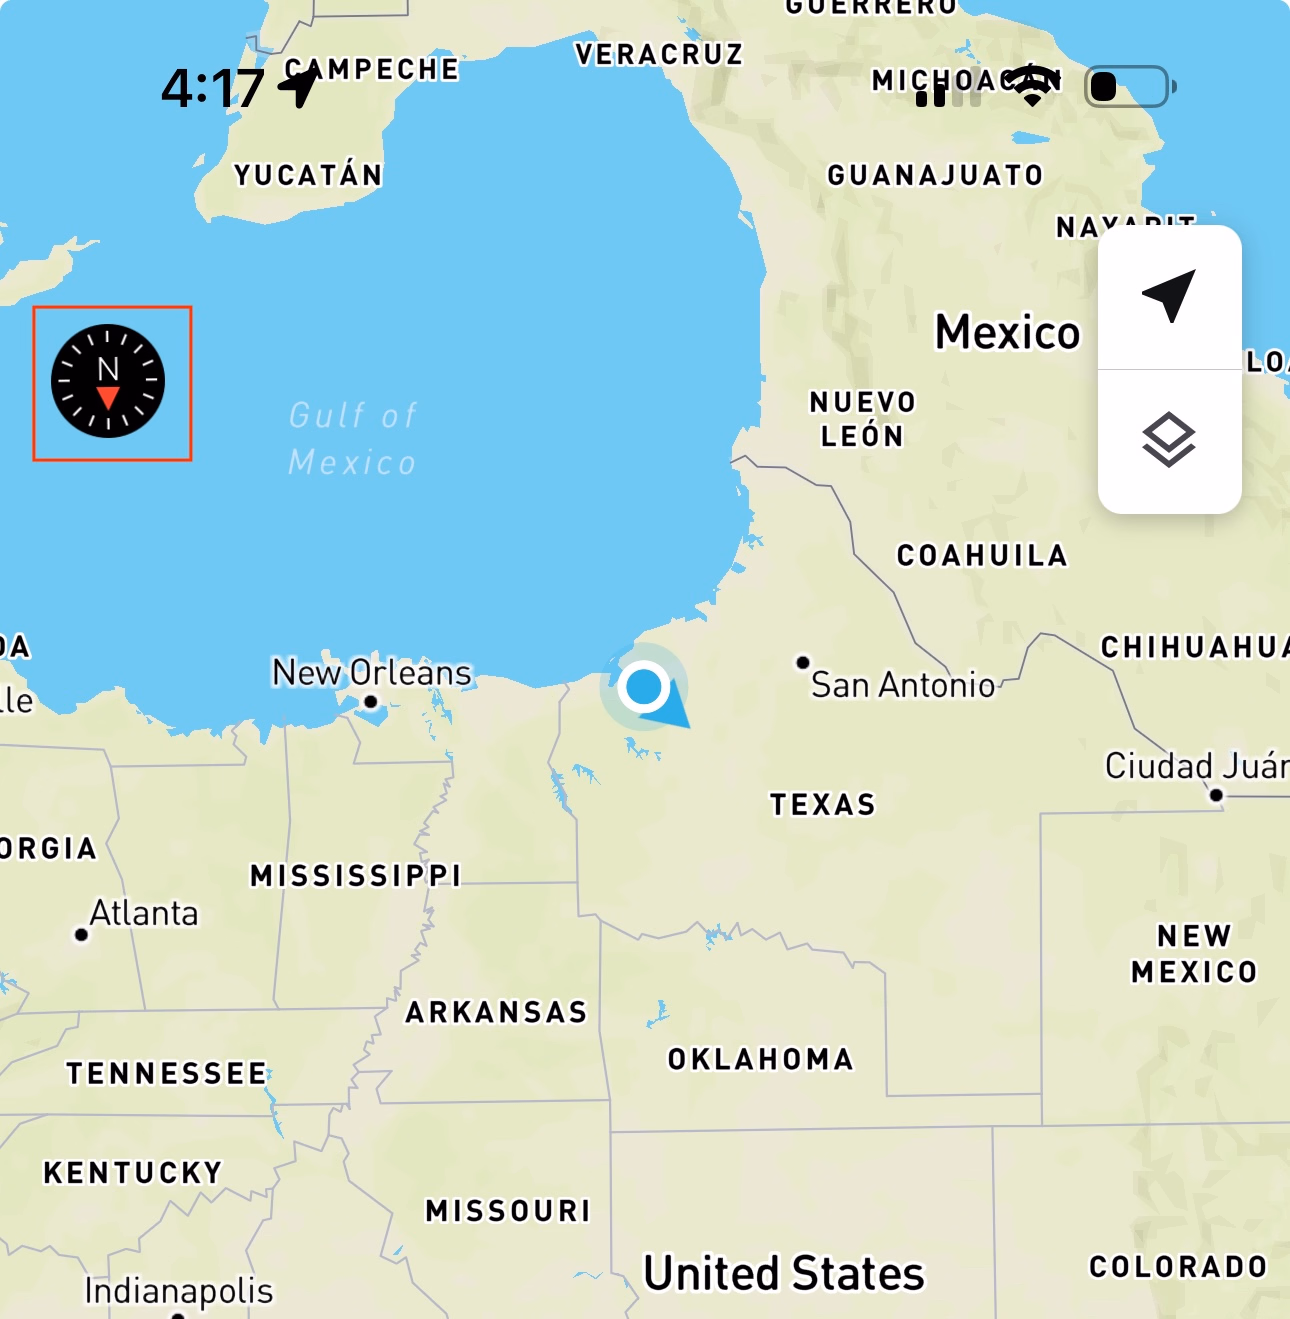
To reorient the map North, click the compass
If the map is oriented True North, the compass disappears
My Location
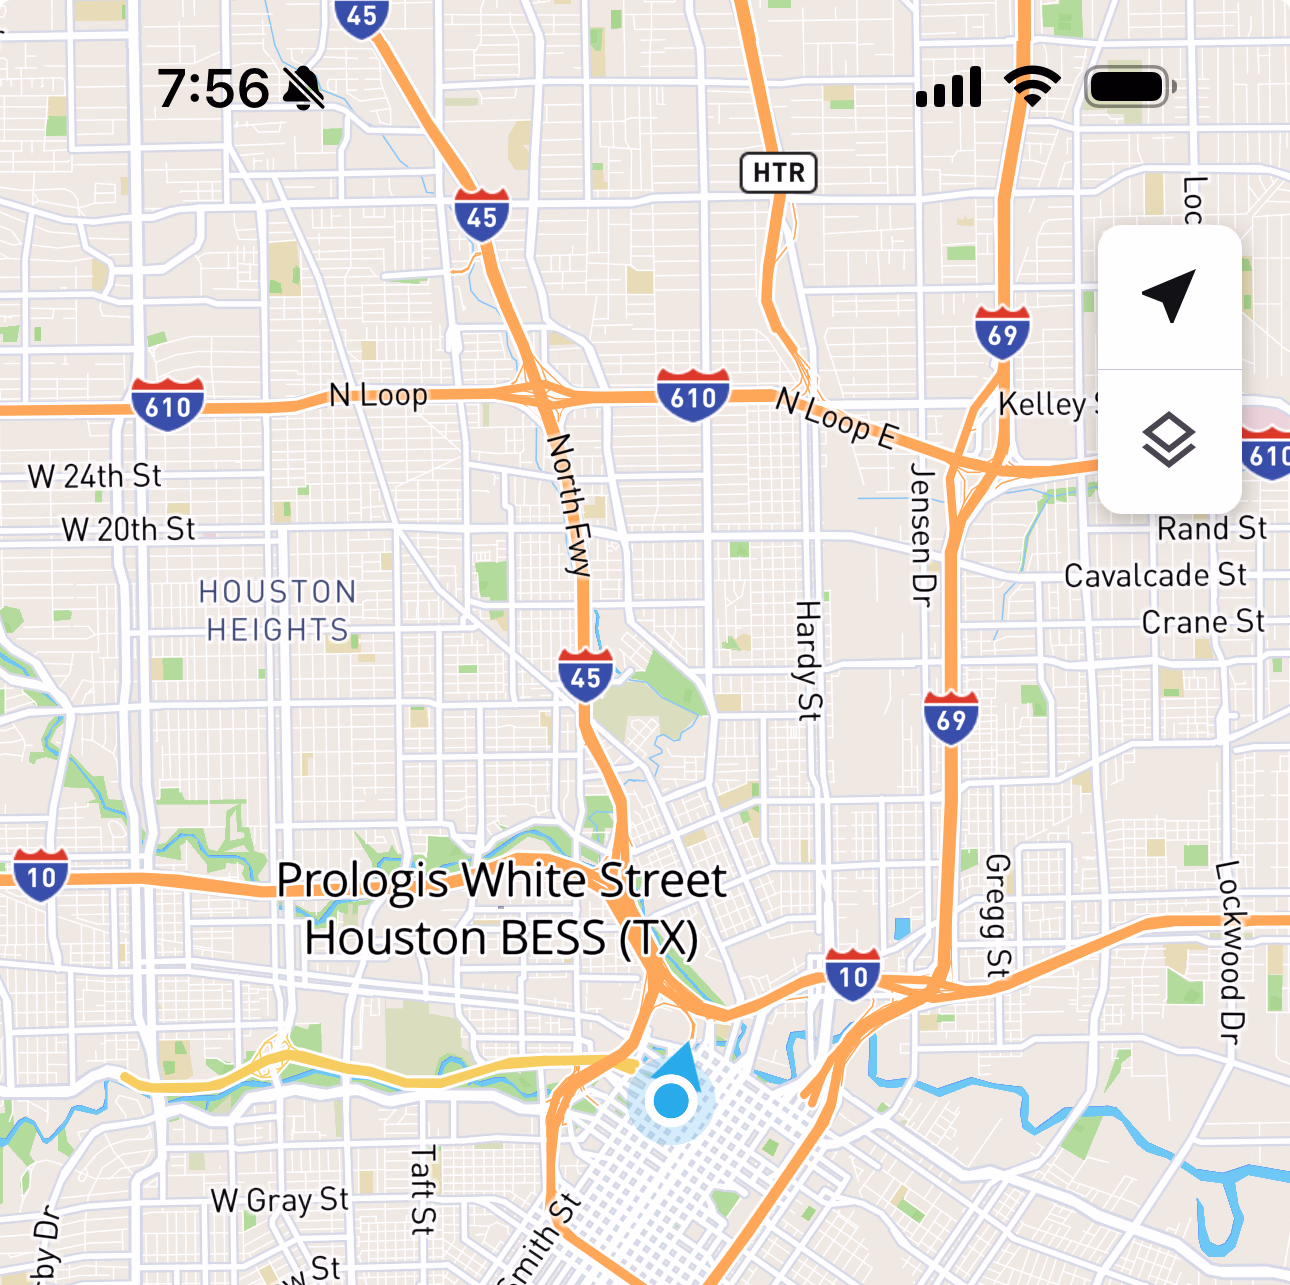
On the Map Screen, you can scroll and zoom to different parts of the Map. The My Location button lets you reset the map view to your current location. To orient the map window onto your current location, tap the My Location button to fly to your current location. When the Map is oriented on your current location, the My Location button will turn blue.
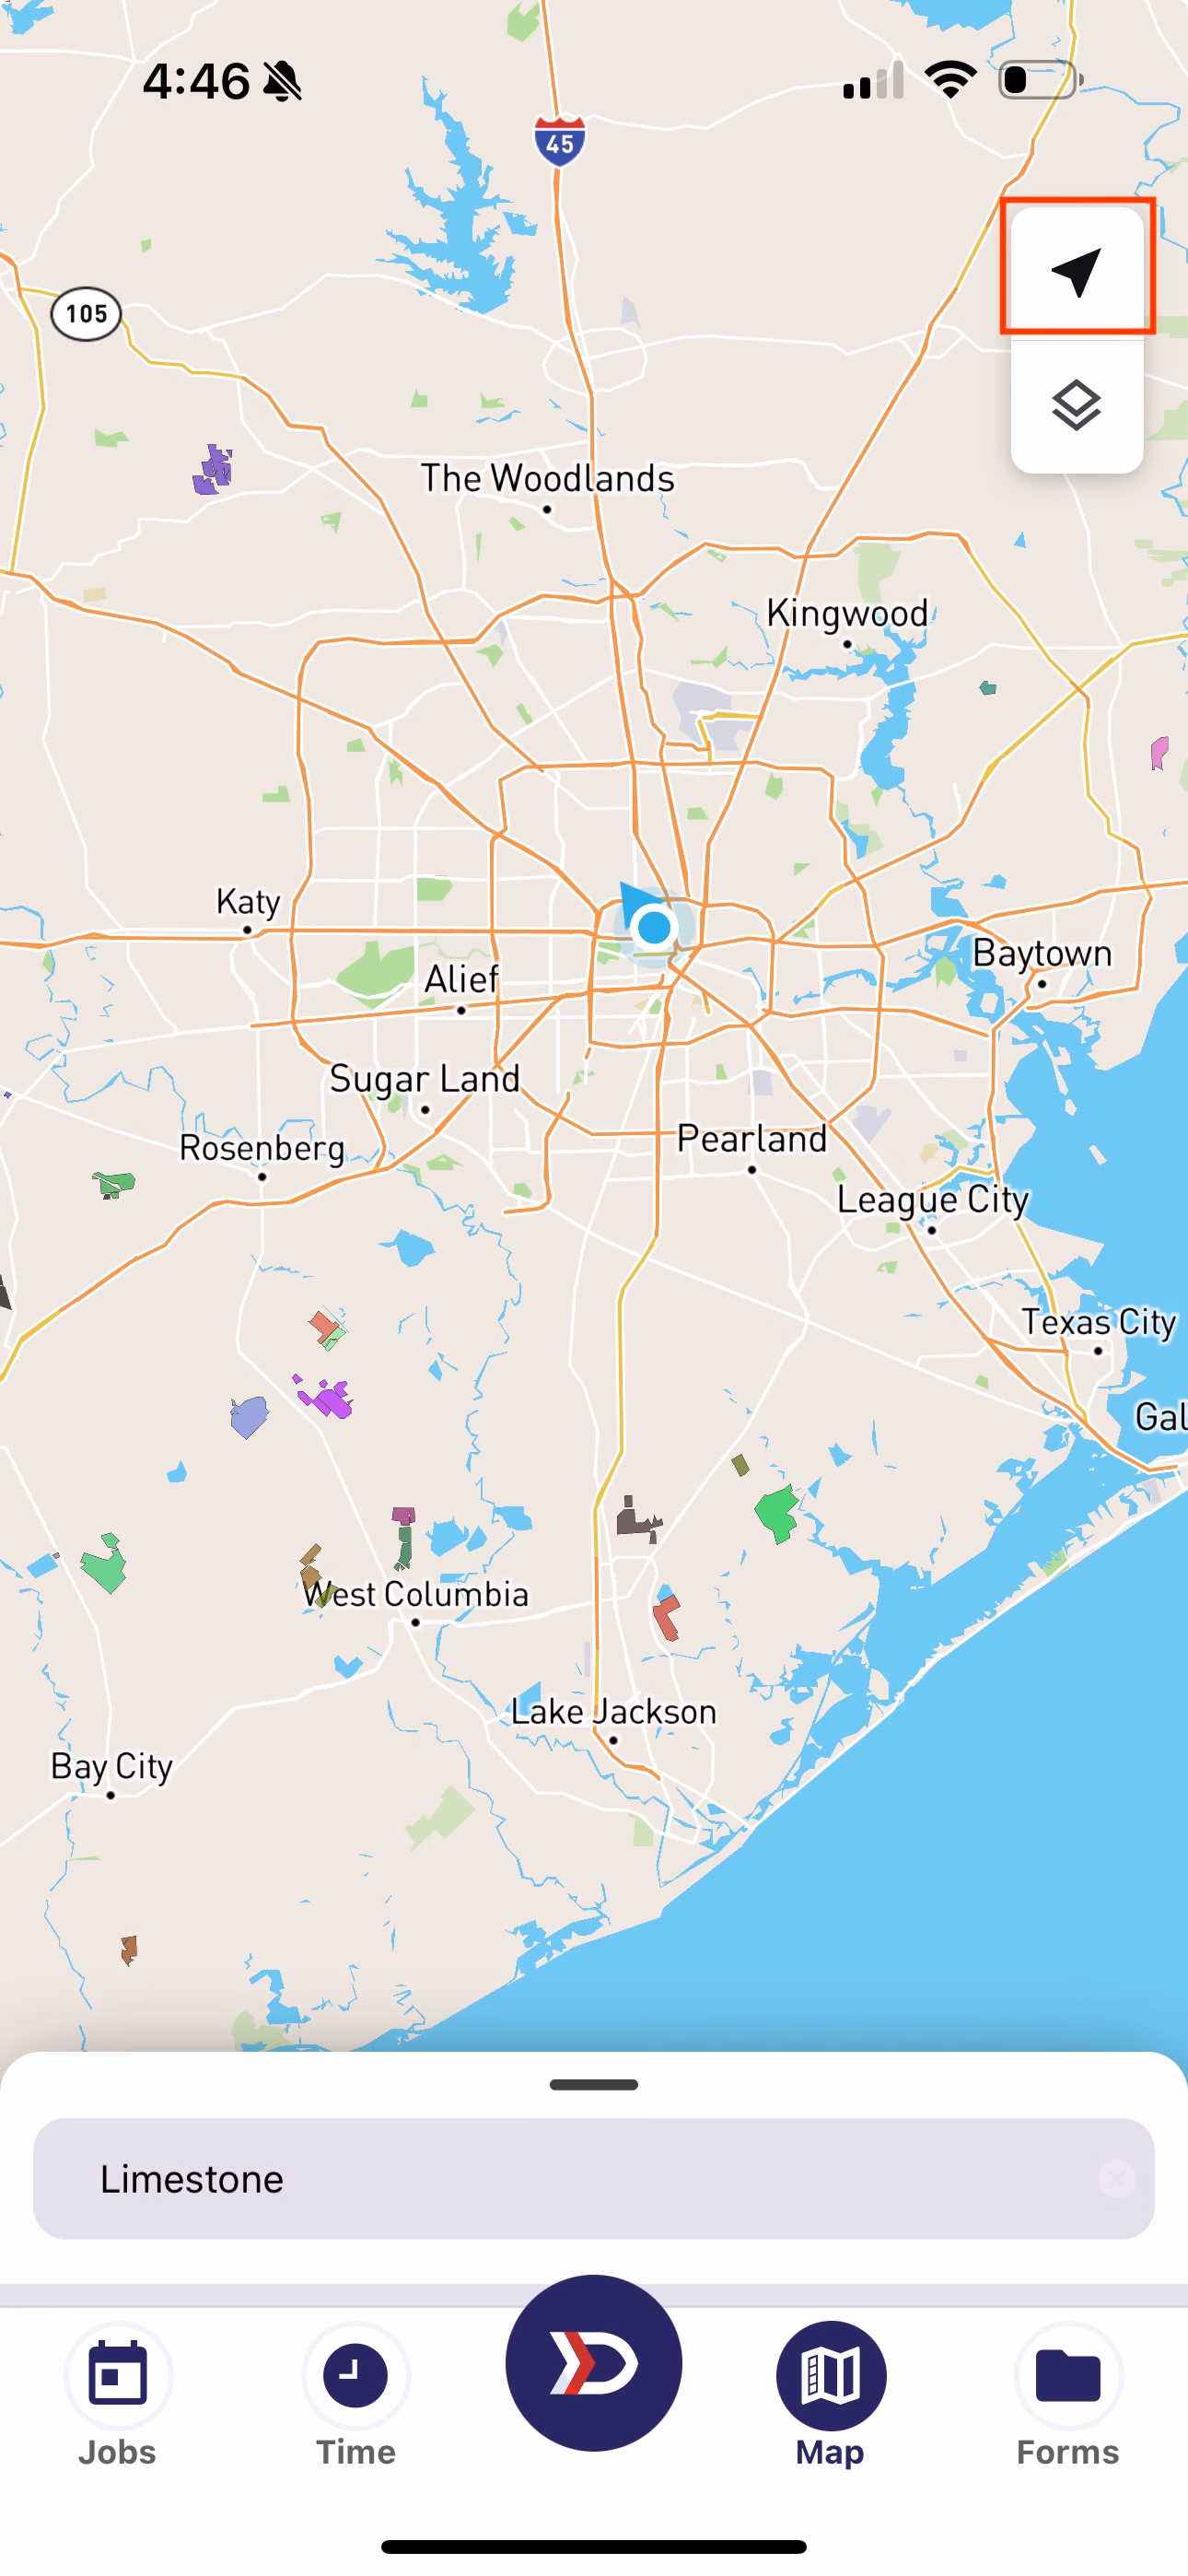
Click the My Location button to zoom to where you are on the map
The My Location icon will turn blue once the map is centered on your location
Layer Tray
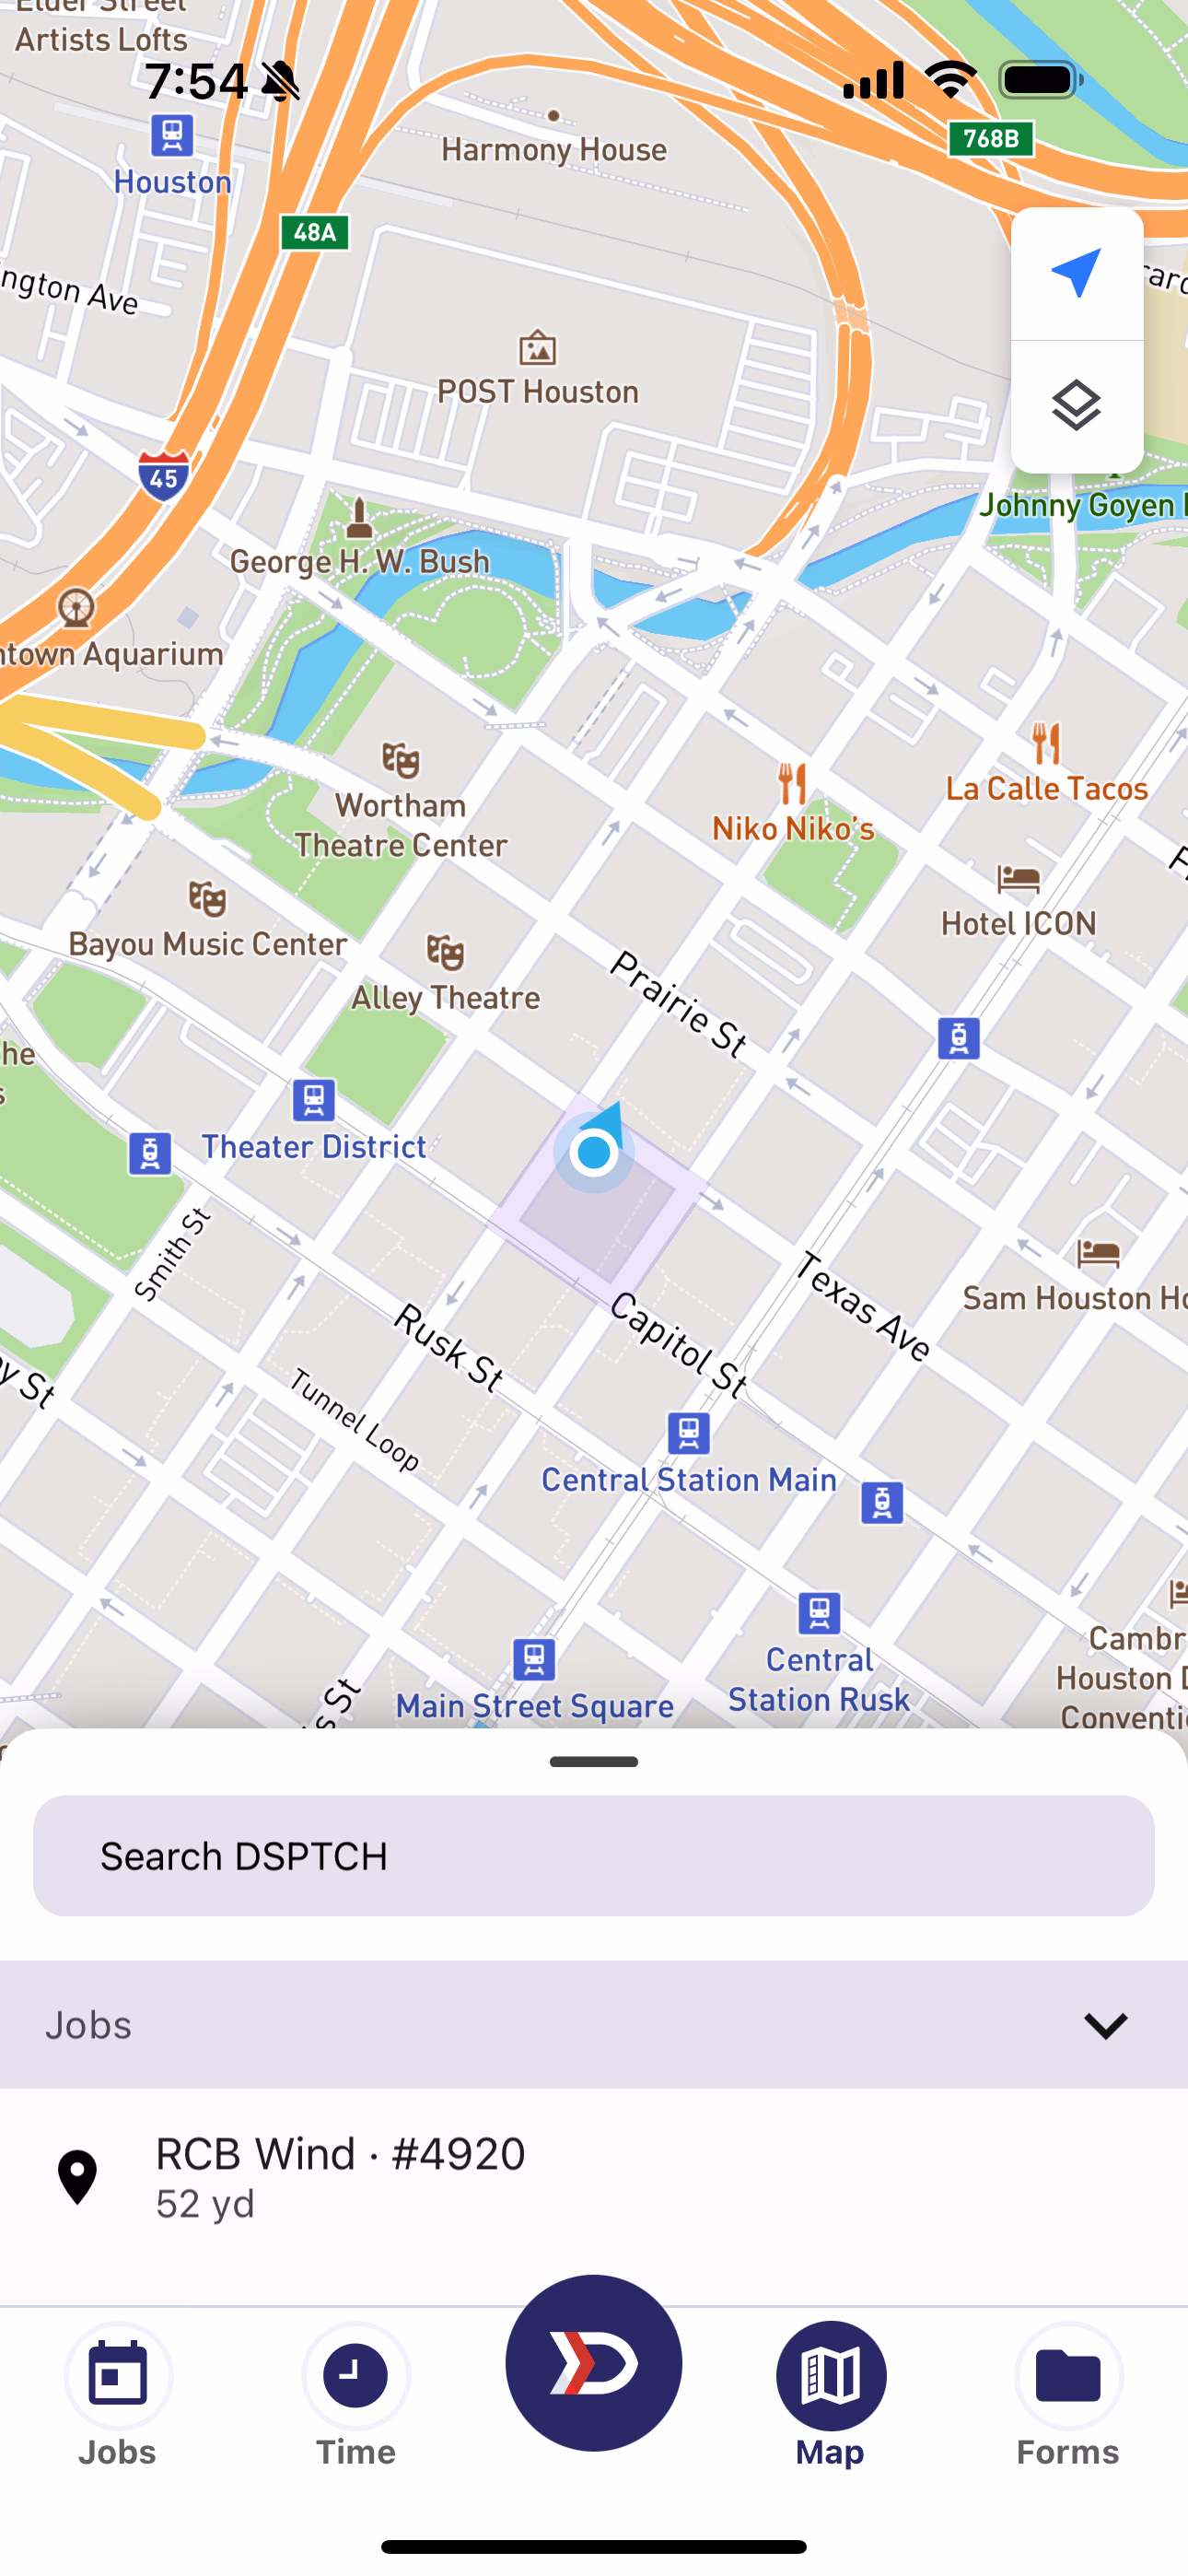
To change the appearance of your map, press the Layer Tray button in the top left corner of the map.
Once selected, the Layer Tray will appear from the bottom of your screen, where the Search Bar is typically located.
Swipe up to expand the Layer Tray, and scroll to find additional configurations.
To close the Layer Tray, swipe down or tap the ✖️ button in the top right of the Layer Tray.

The Layer Tray button changes the map's appearance
Press the X to close, or swipe down
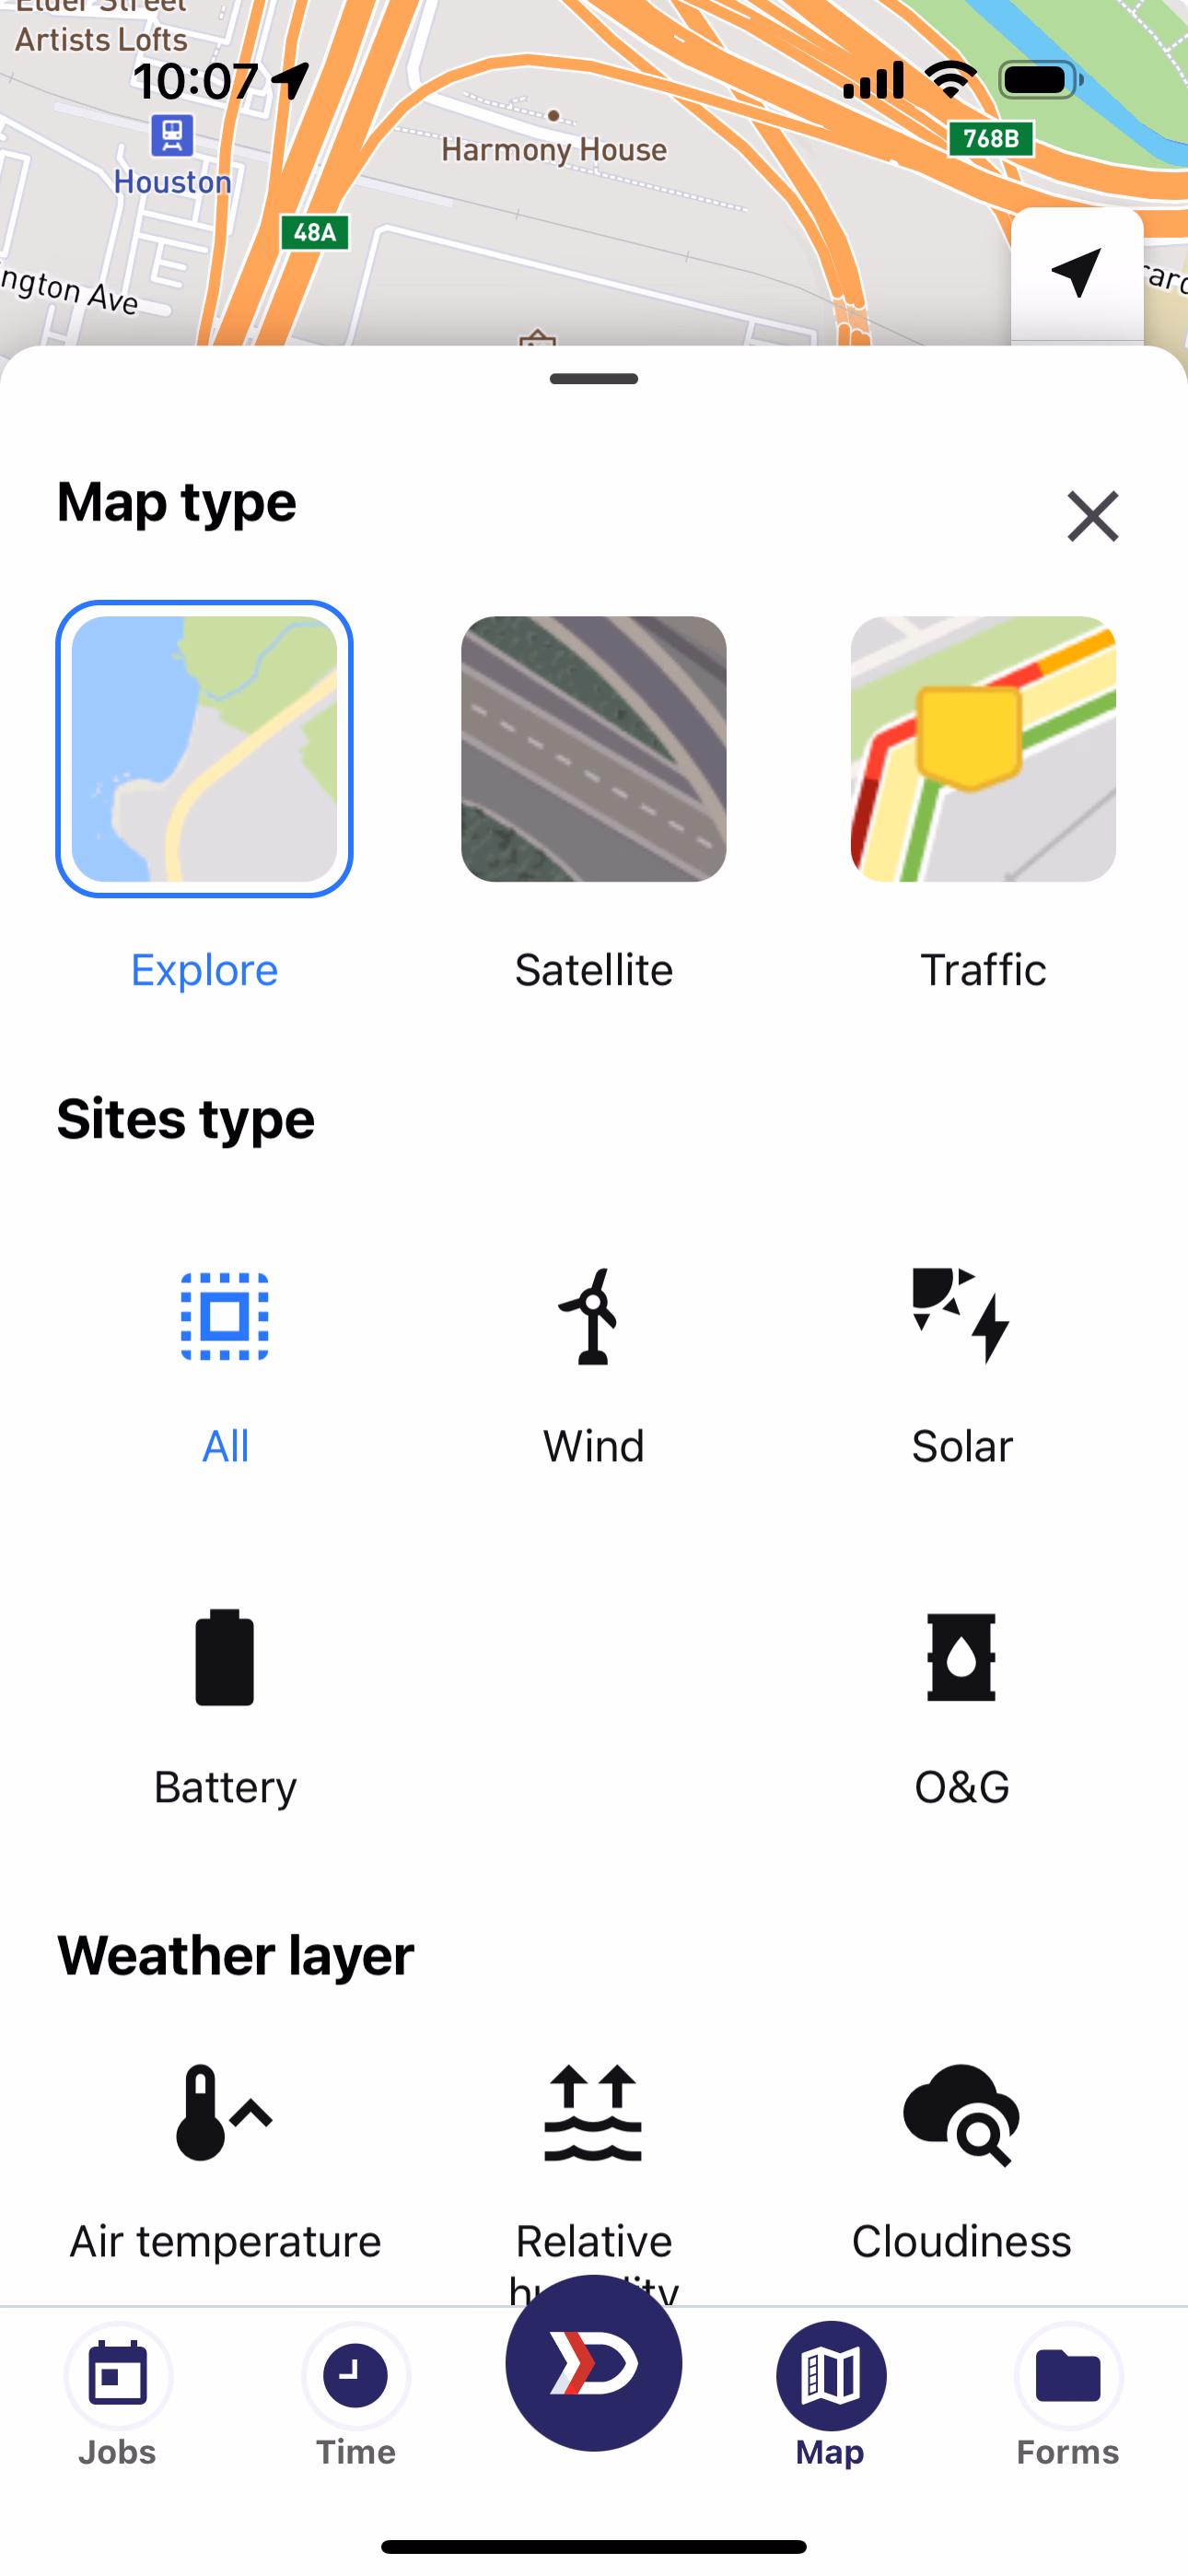
Layer Tray Configuration
In the Layer Tray, there are options to configure the style of the underlying map, the interactive locations on the map, and the non-interactive layers that show onto of the map.
- Map Type
- Site Type
- Weather Layer
Map Type
Explore is the default map, displaying road names and Points of Interest. Satellite displays the terrain and ground cover as captured from an aerial view of the Earth. Traffic shows road congestion and closers adjacent to the road network.
- Explore
- Satellite
- Traffic
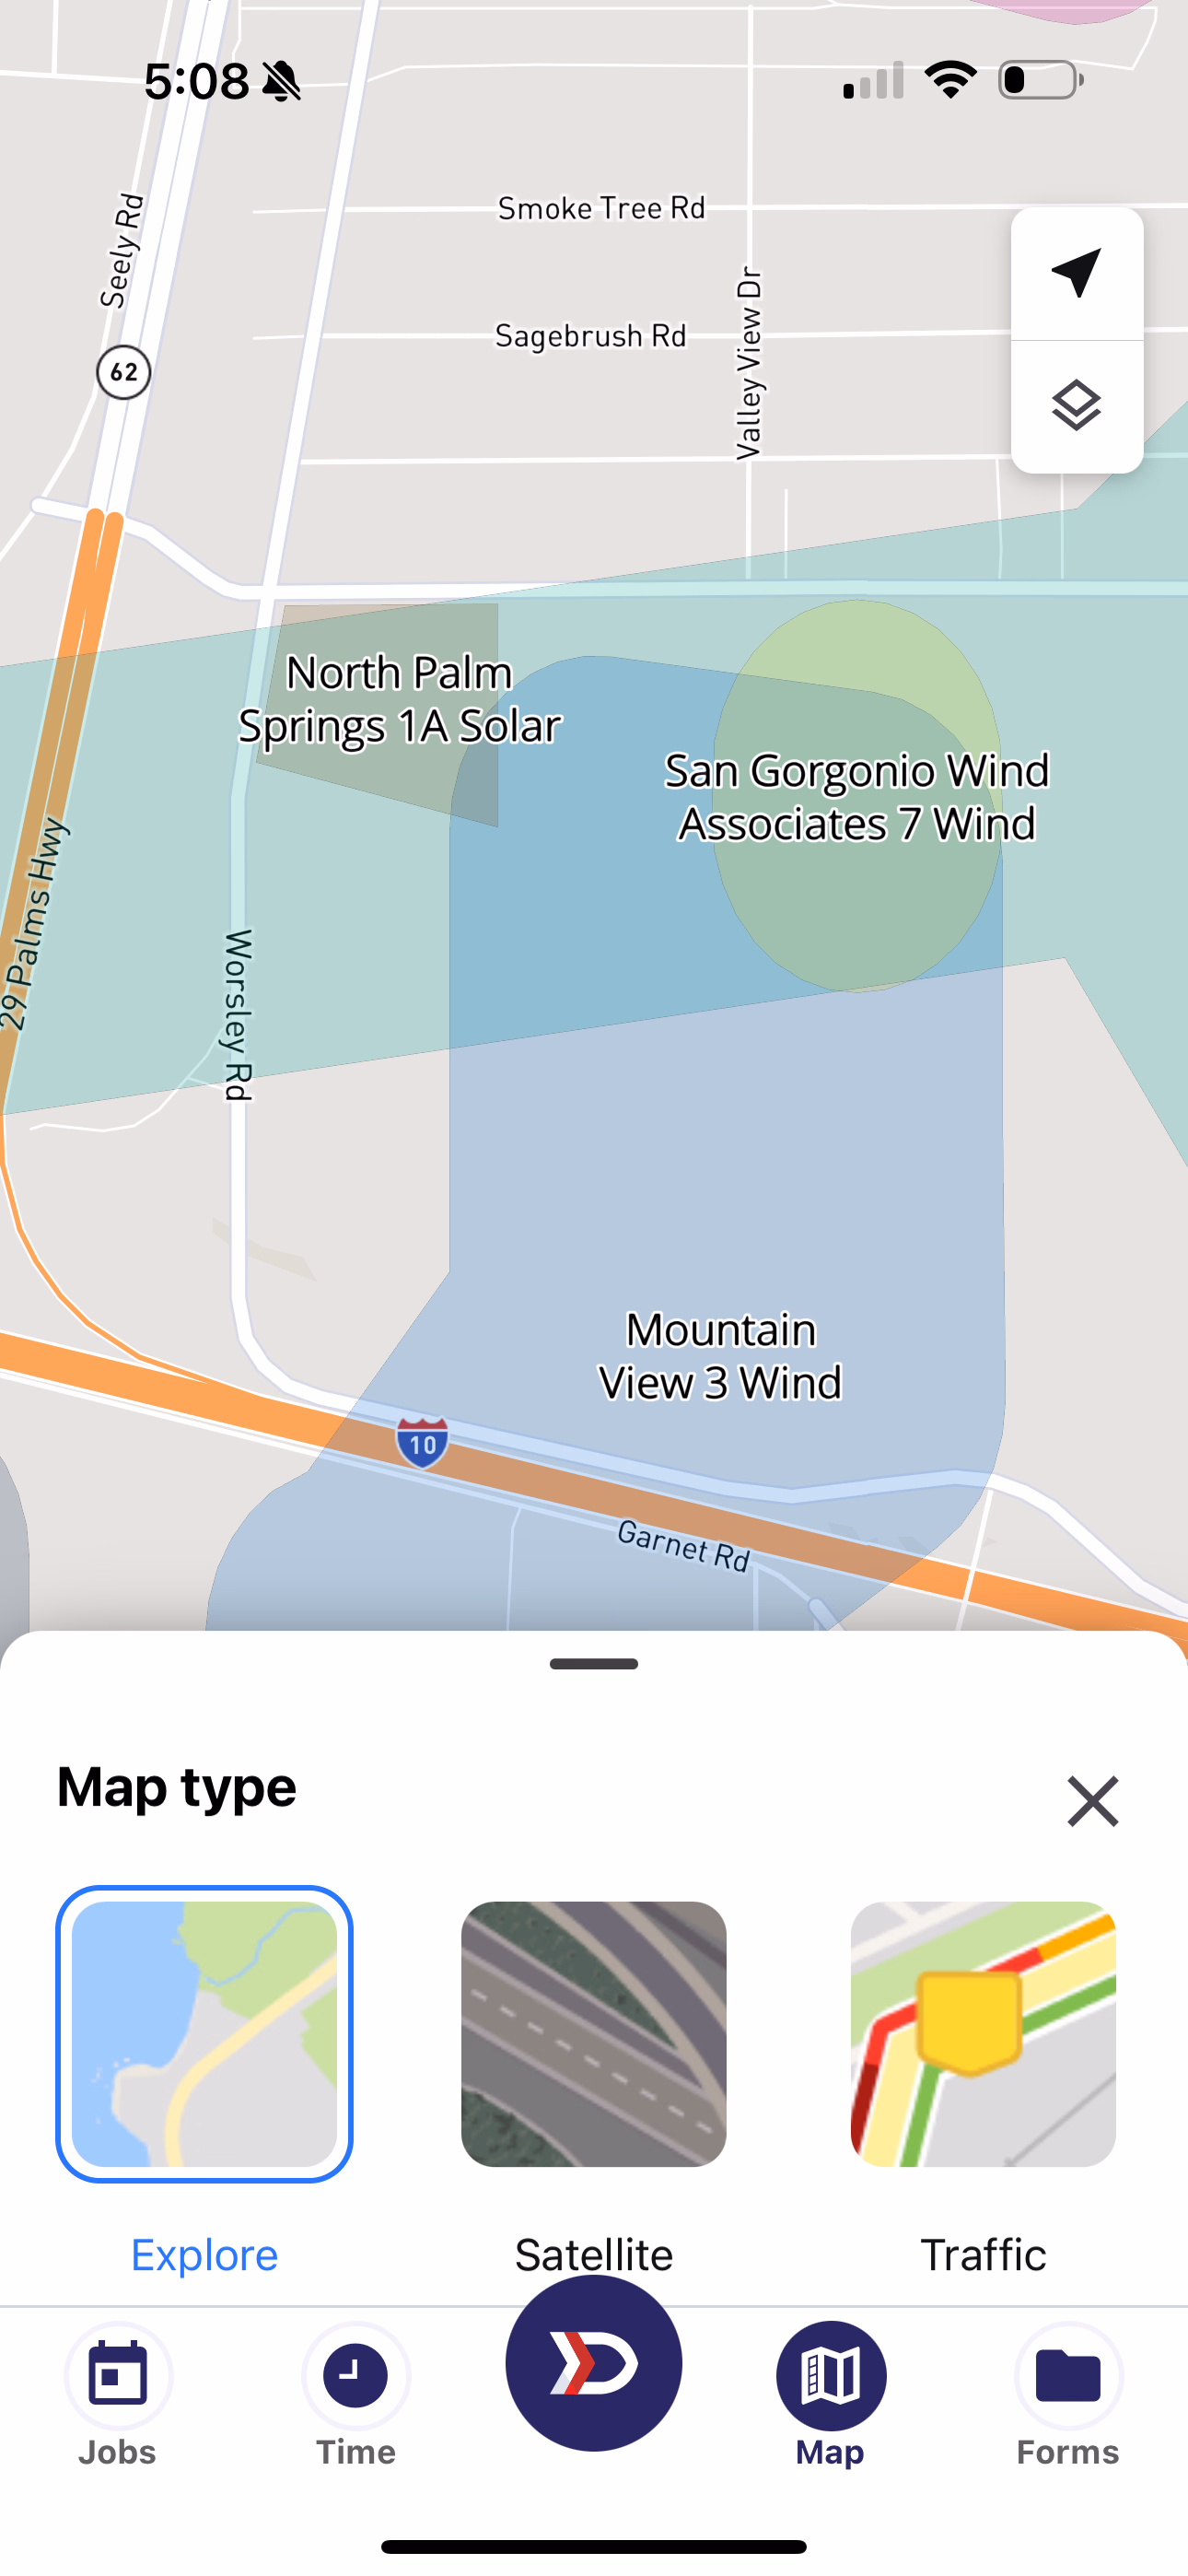
Default Explore Layer
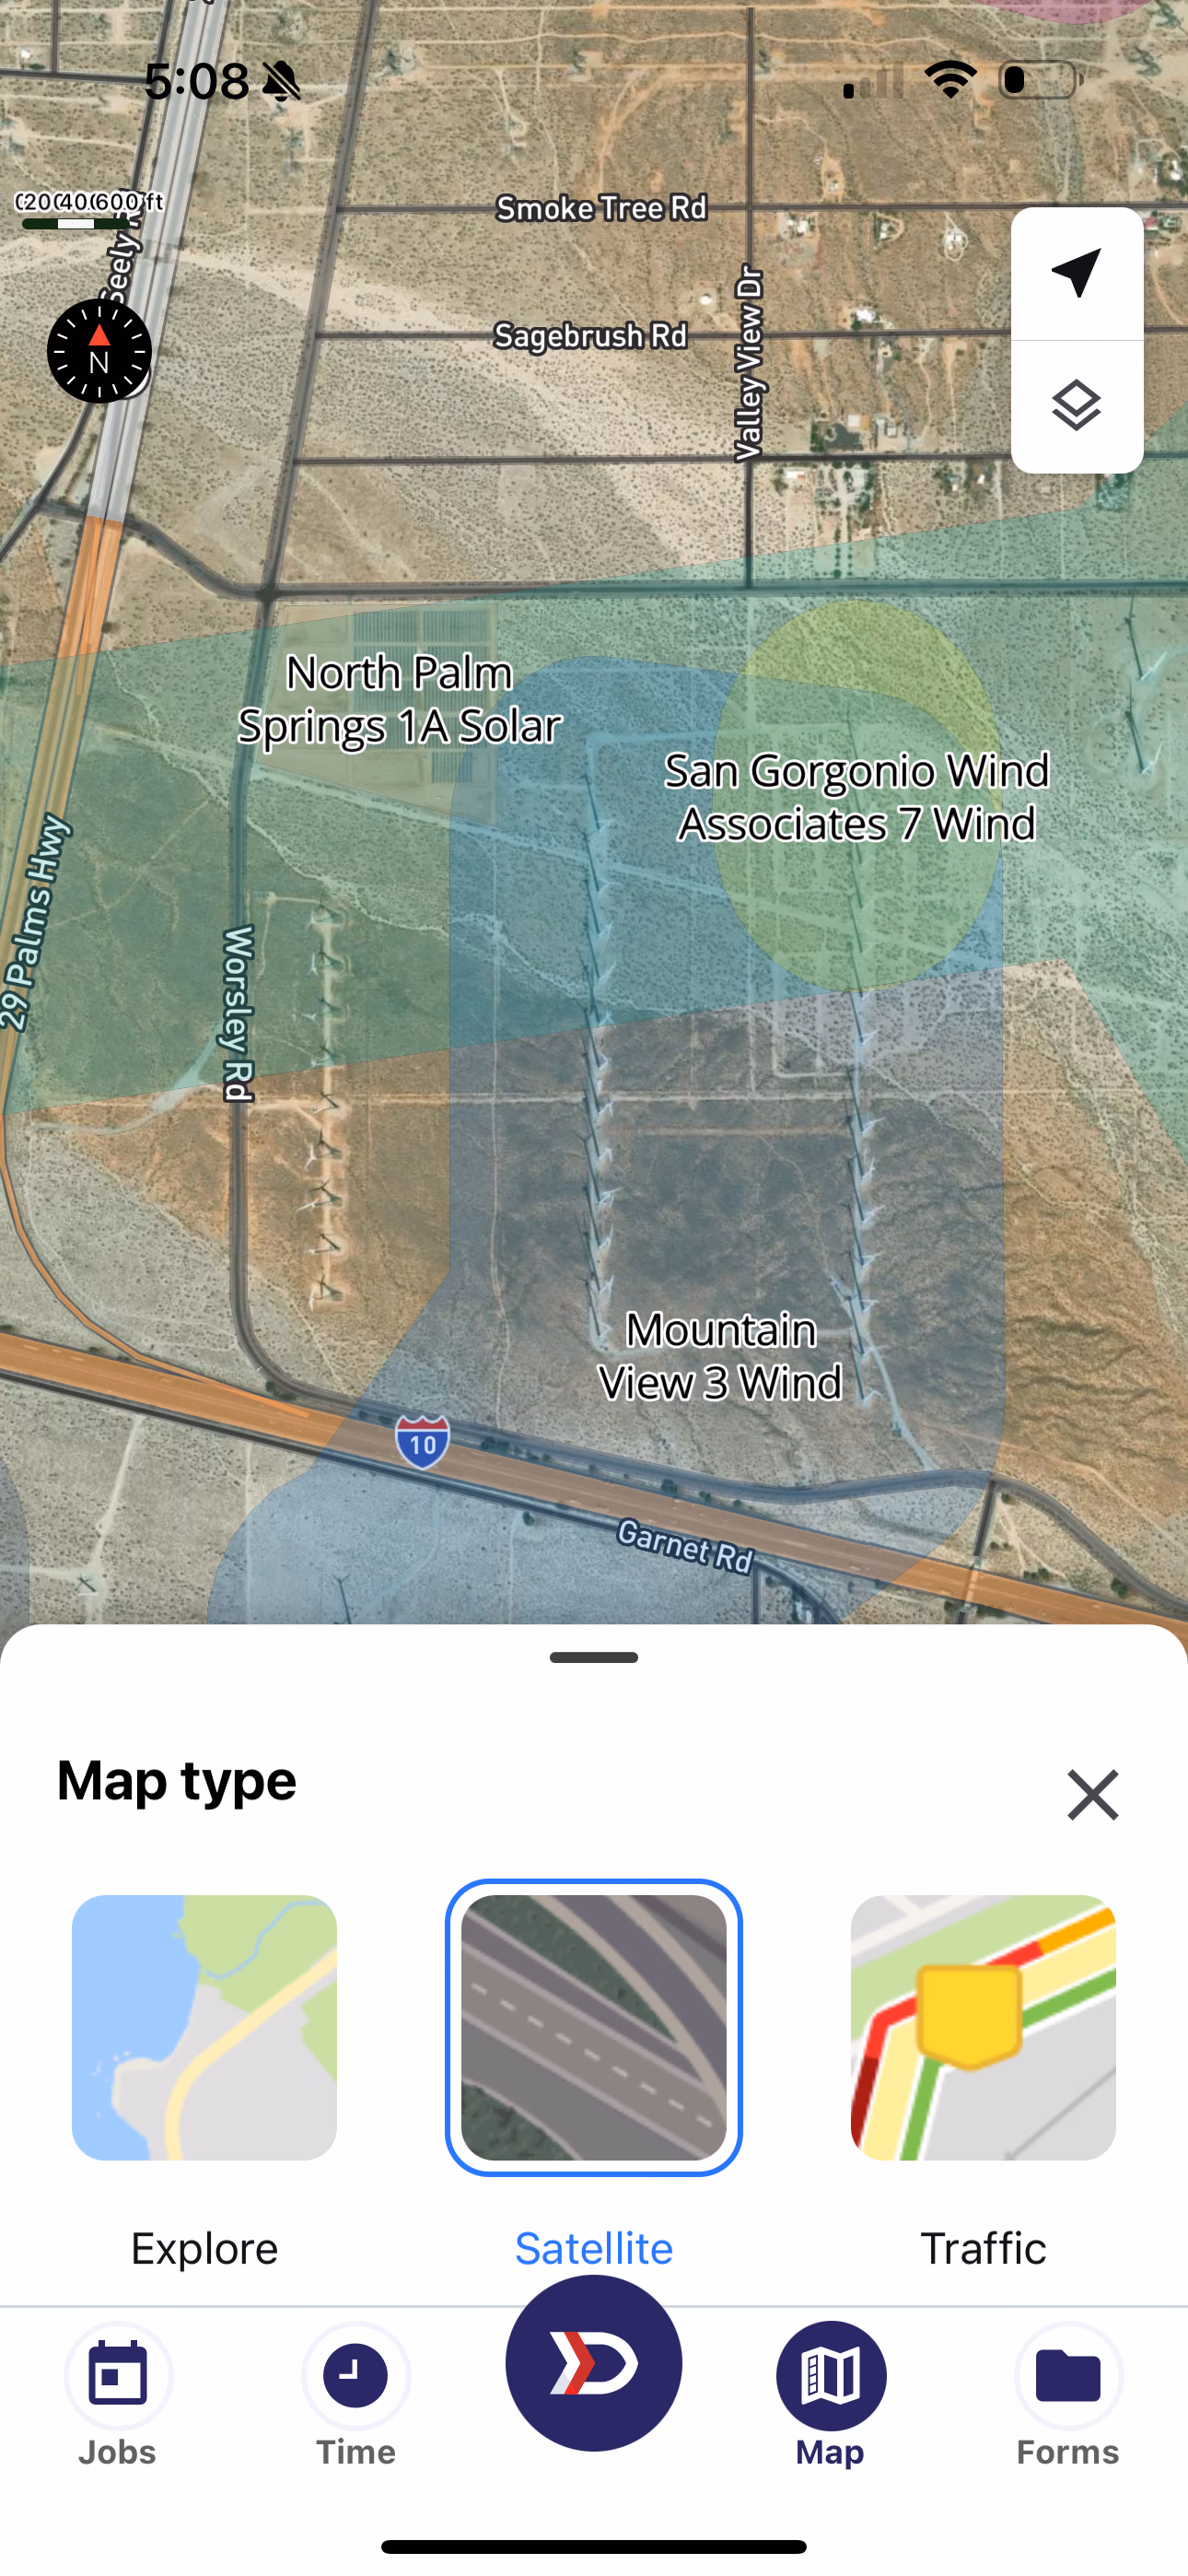
Satellite Map Layer
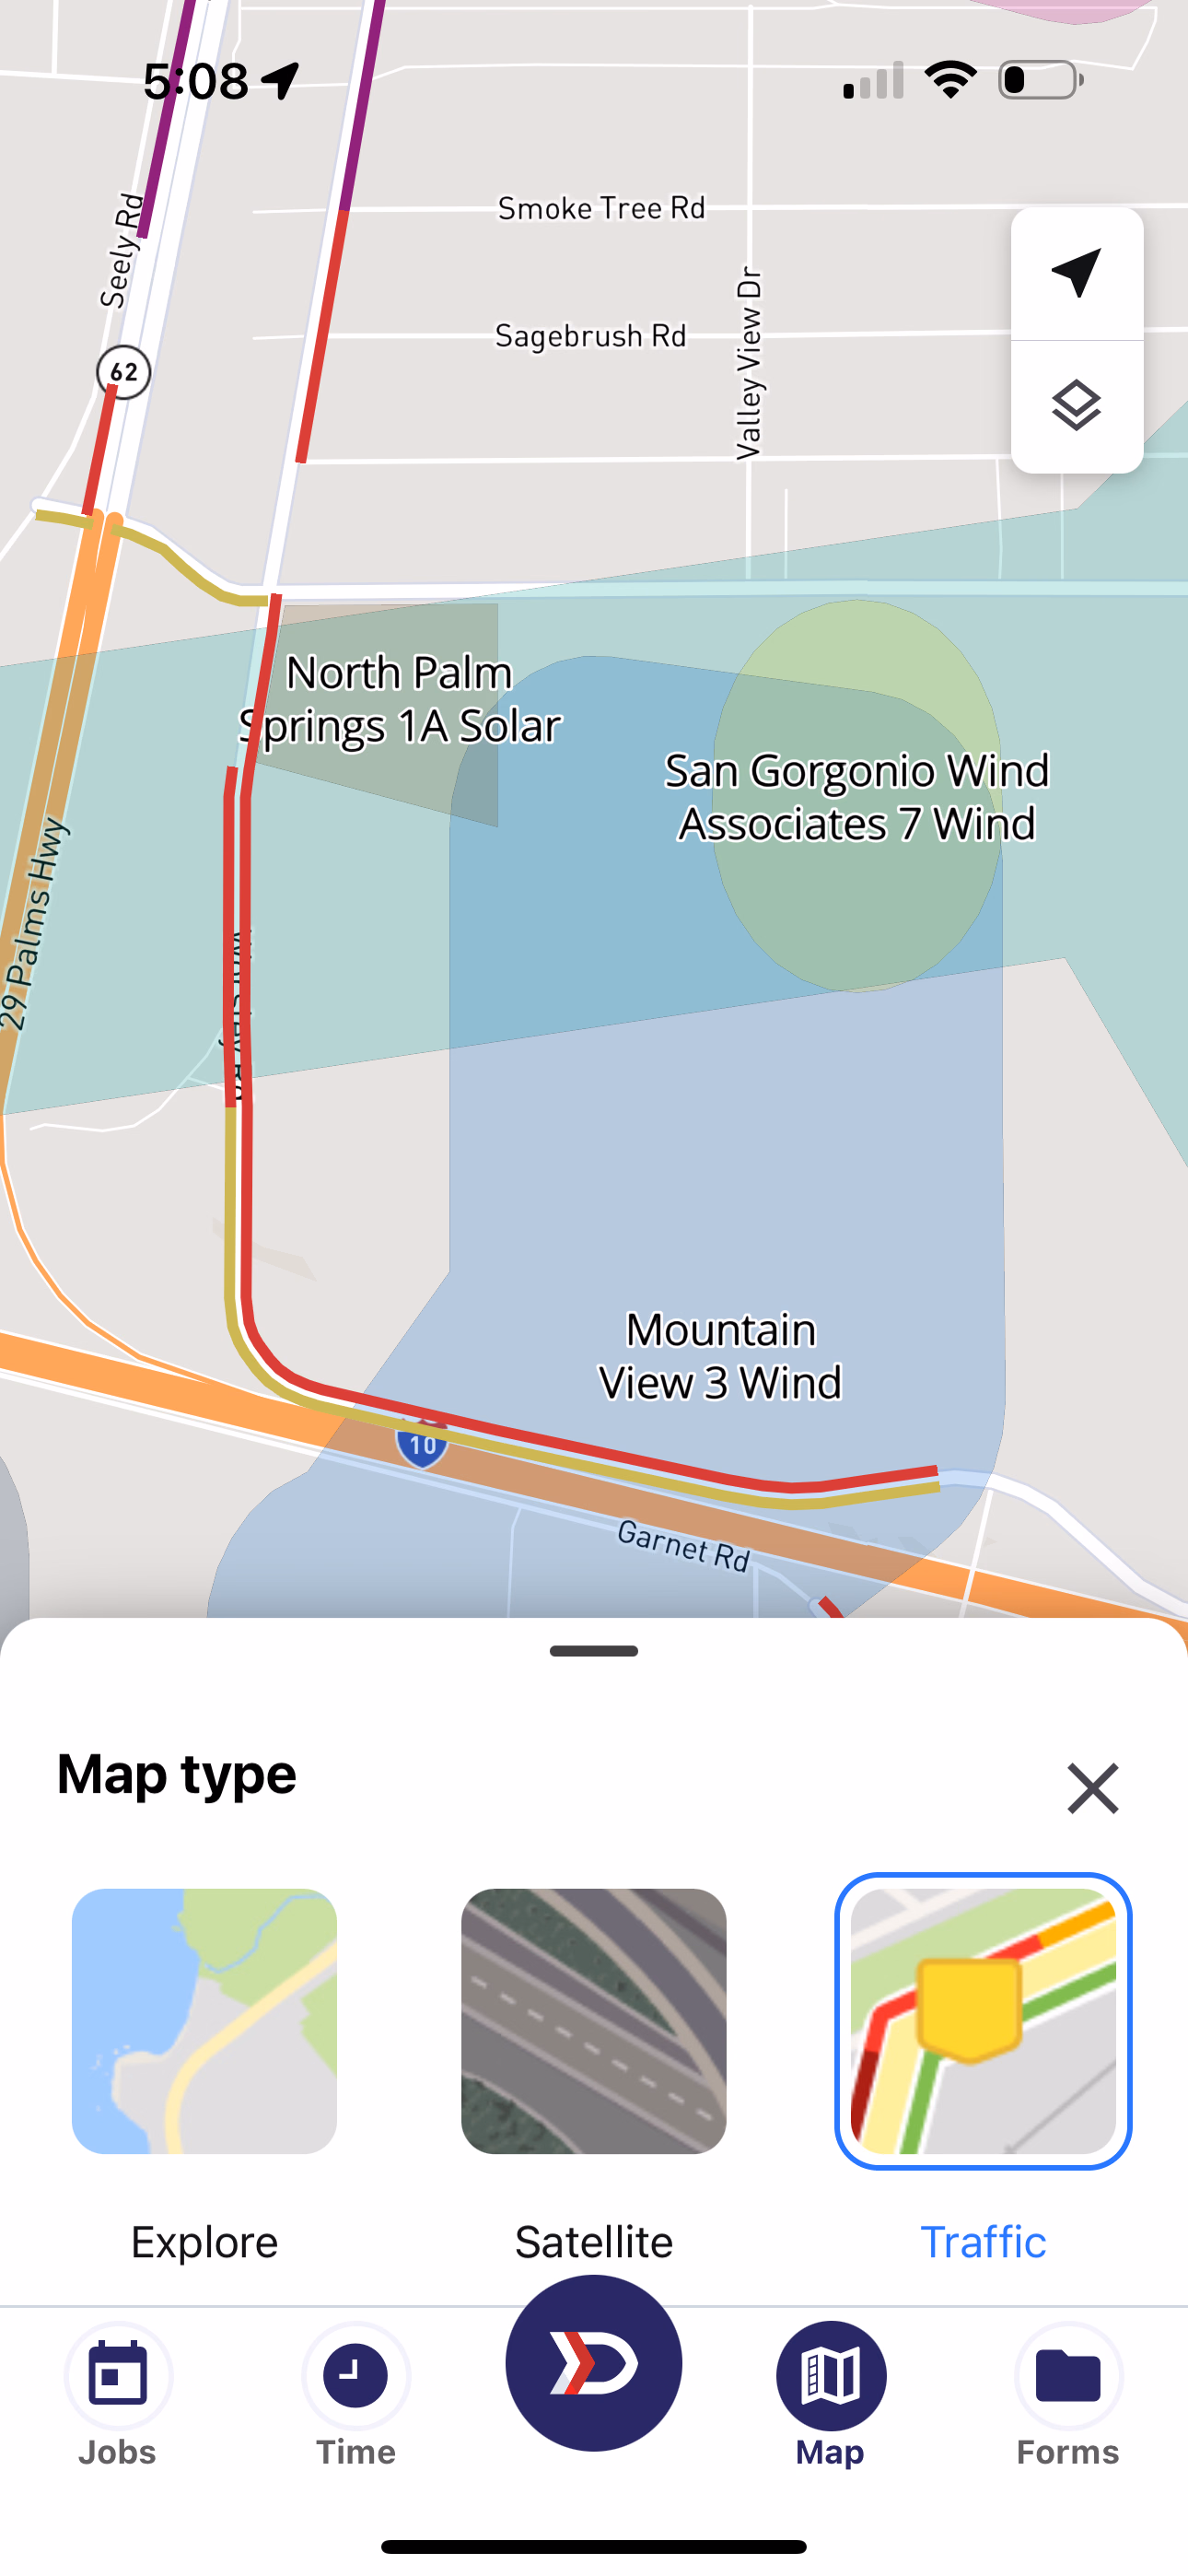
Traffic Map Layer
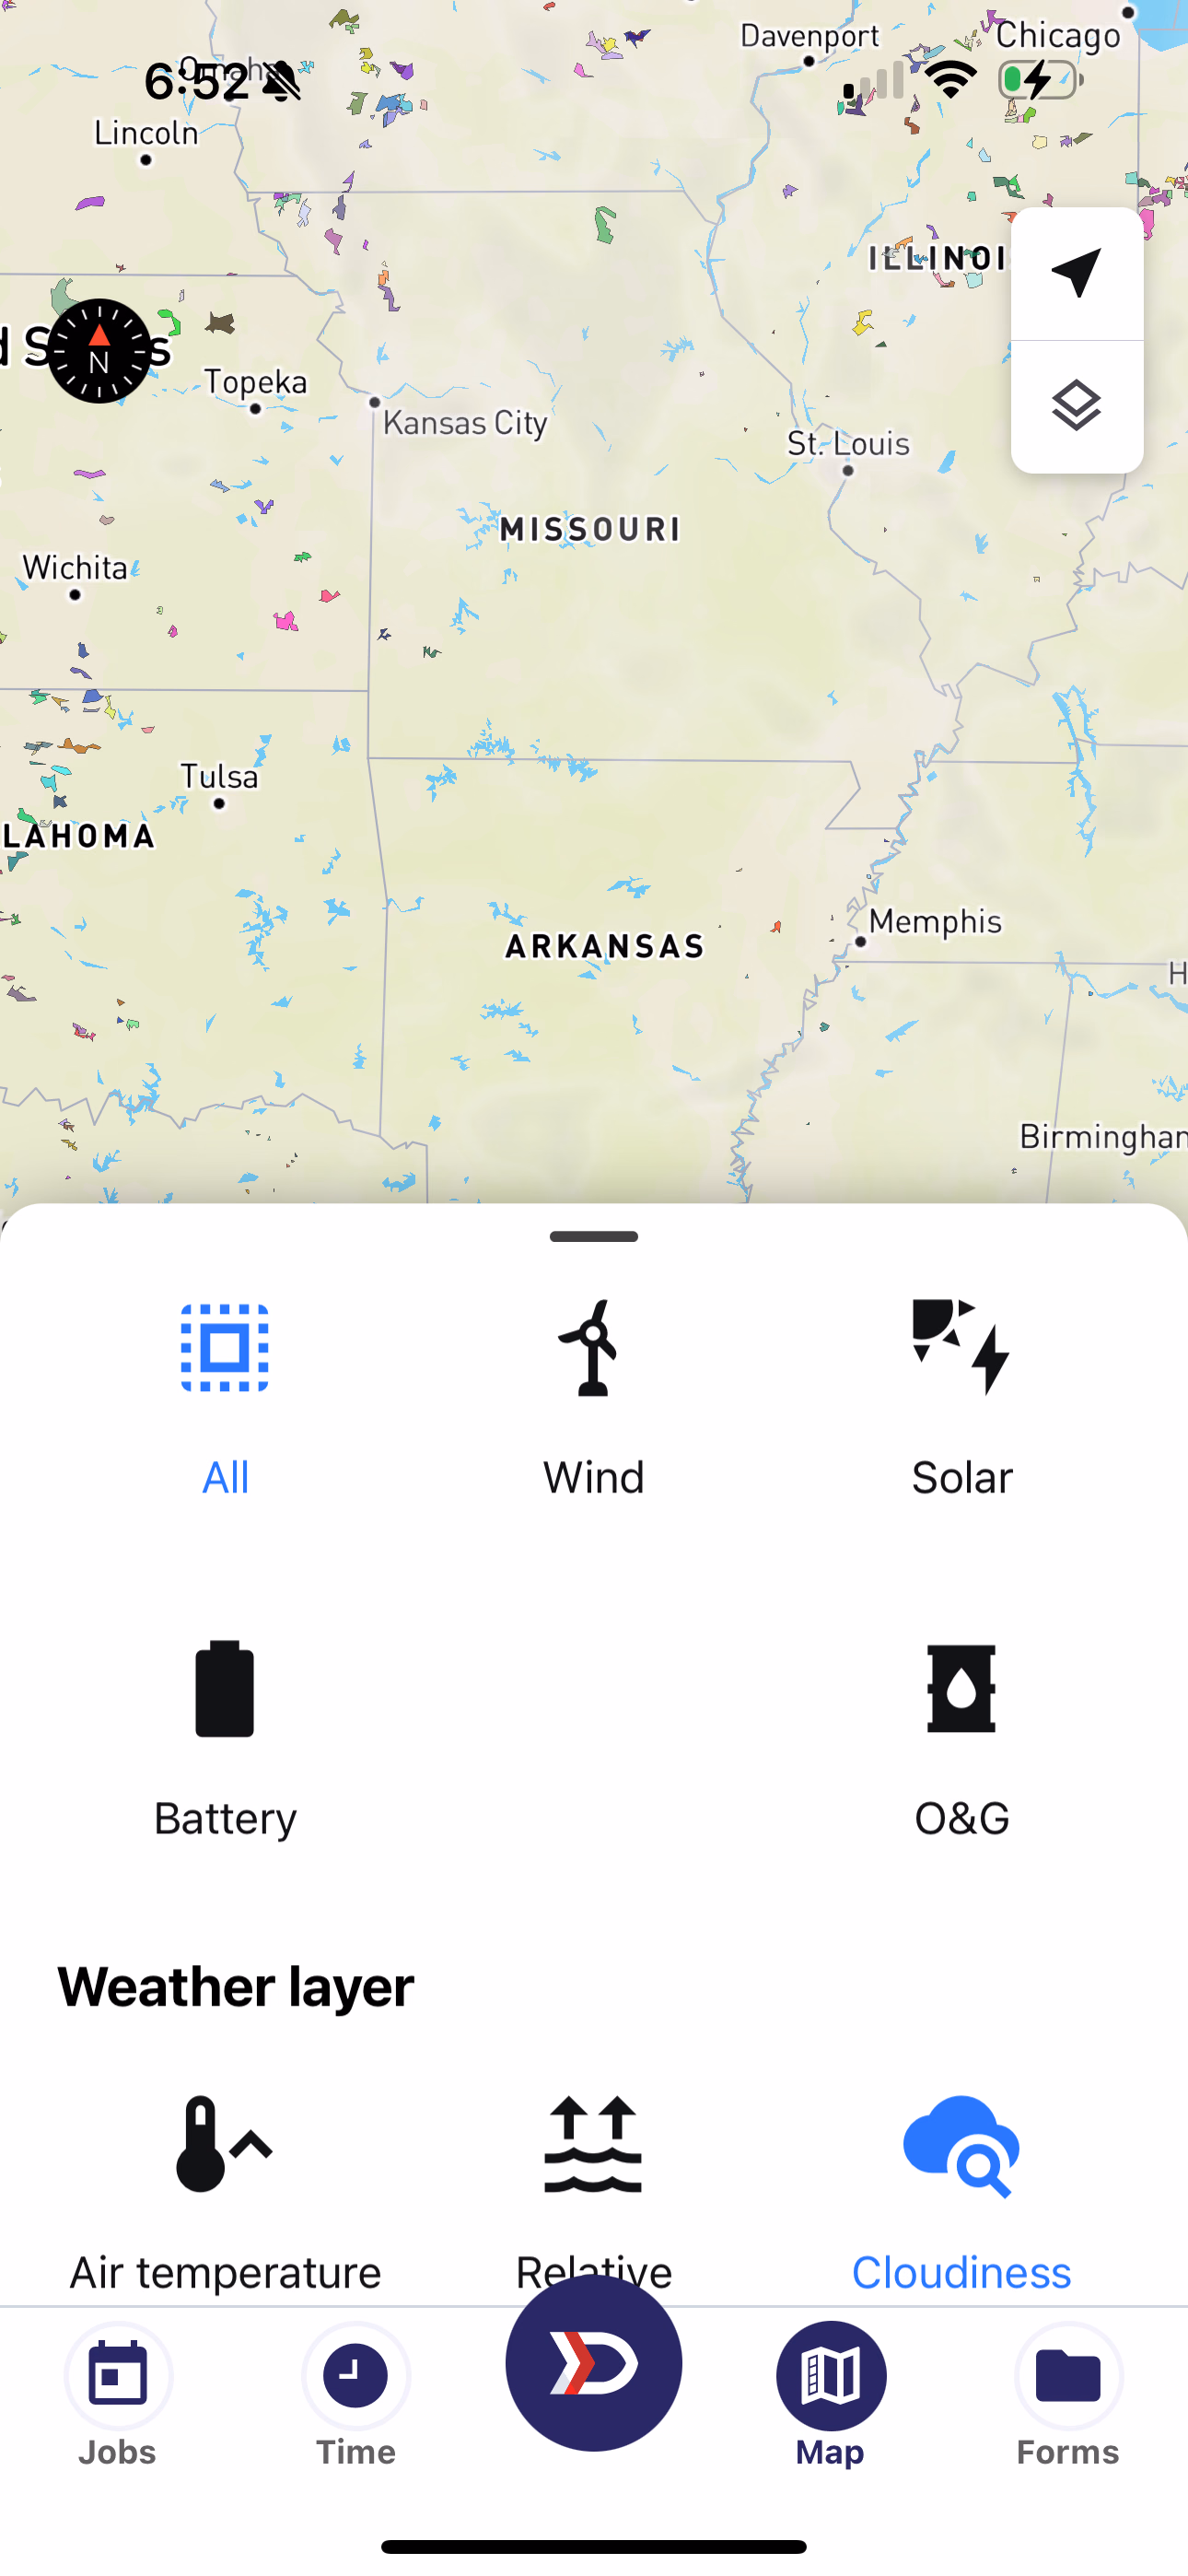
Site Type
The selected Site Type determines what interactive locations are displayed on the map, as well as the DSPTCH locations that are returned by search. If you are only interested in a particular type of Location, you can filter the map to only the locations of interest.
- All
- Wind
- Solar
- Battery
- O&G
- Power Plant
Because of the massive number of Oil & Gas locations in North America, you must select O&G to search for Oil & Gas Locations. This allows for optimal performance and enhanced searchability.
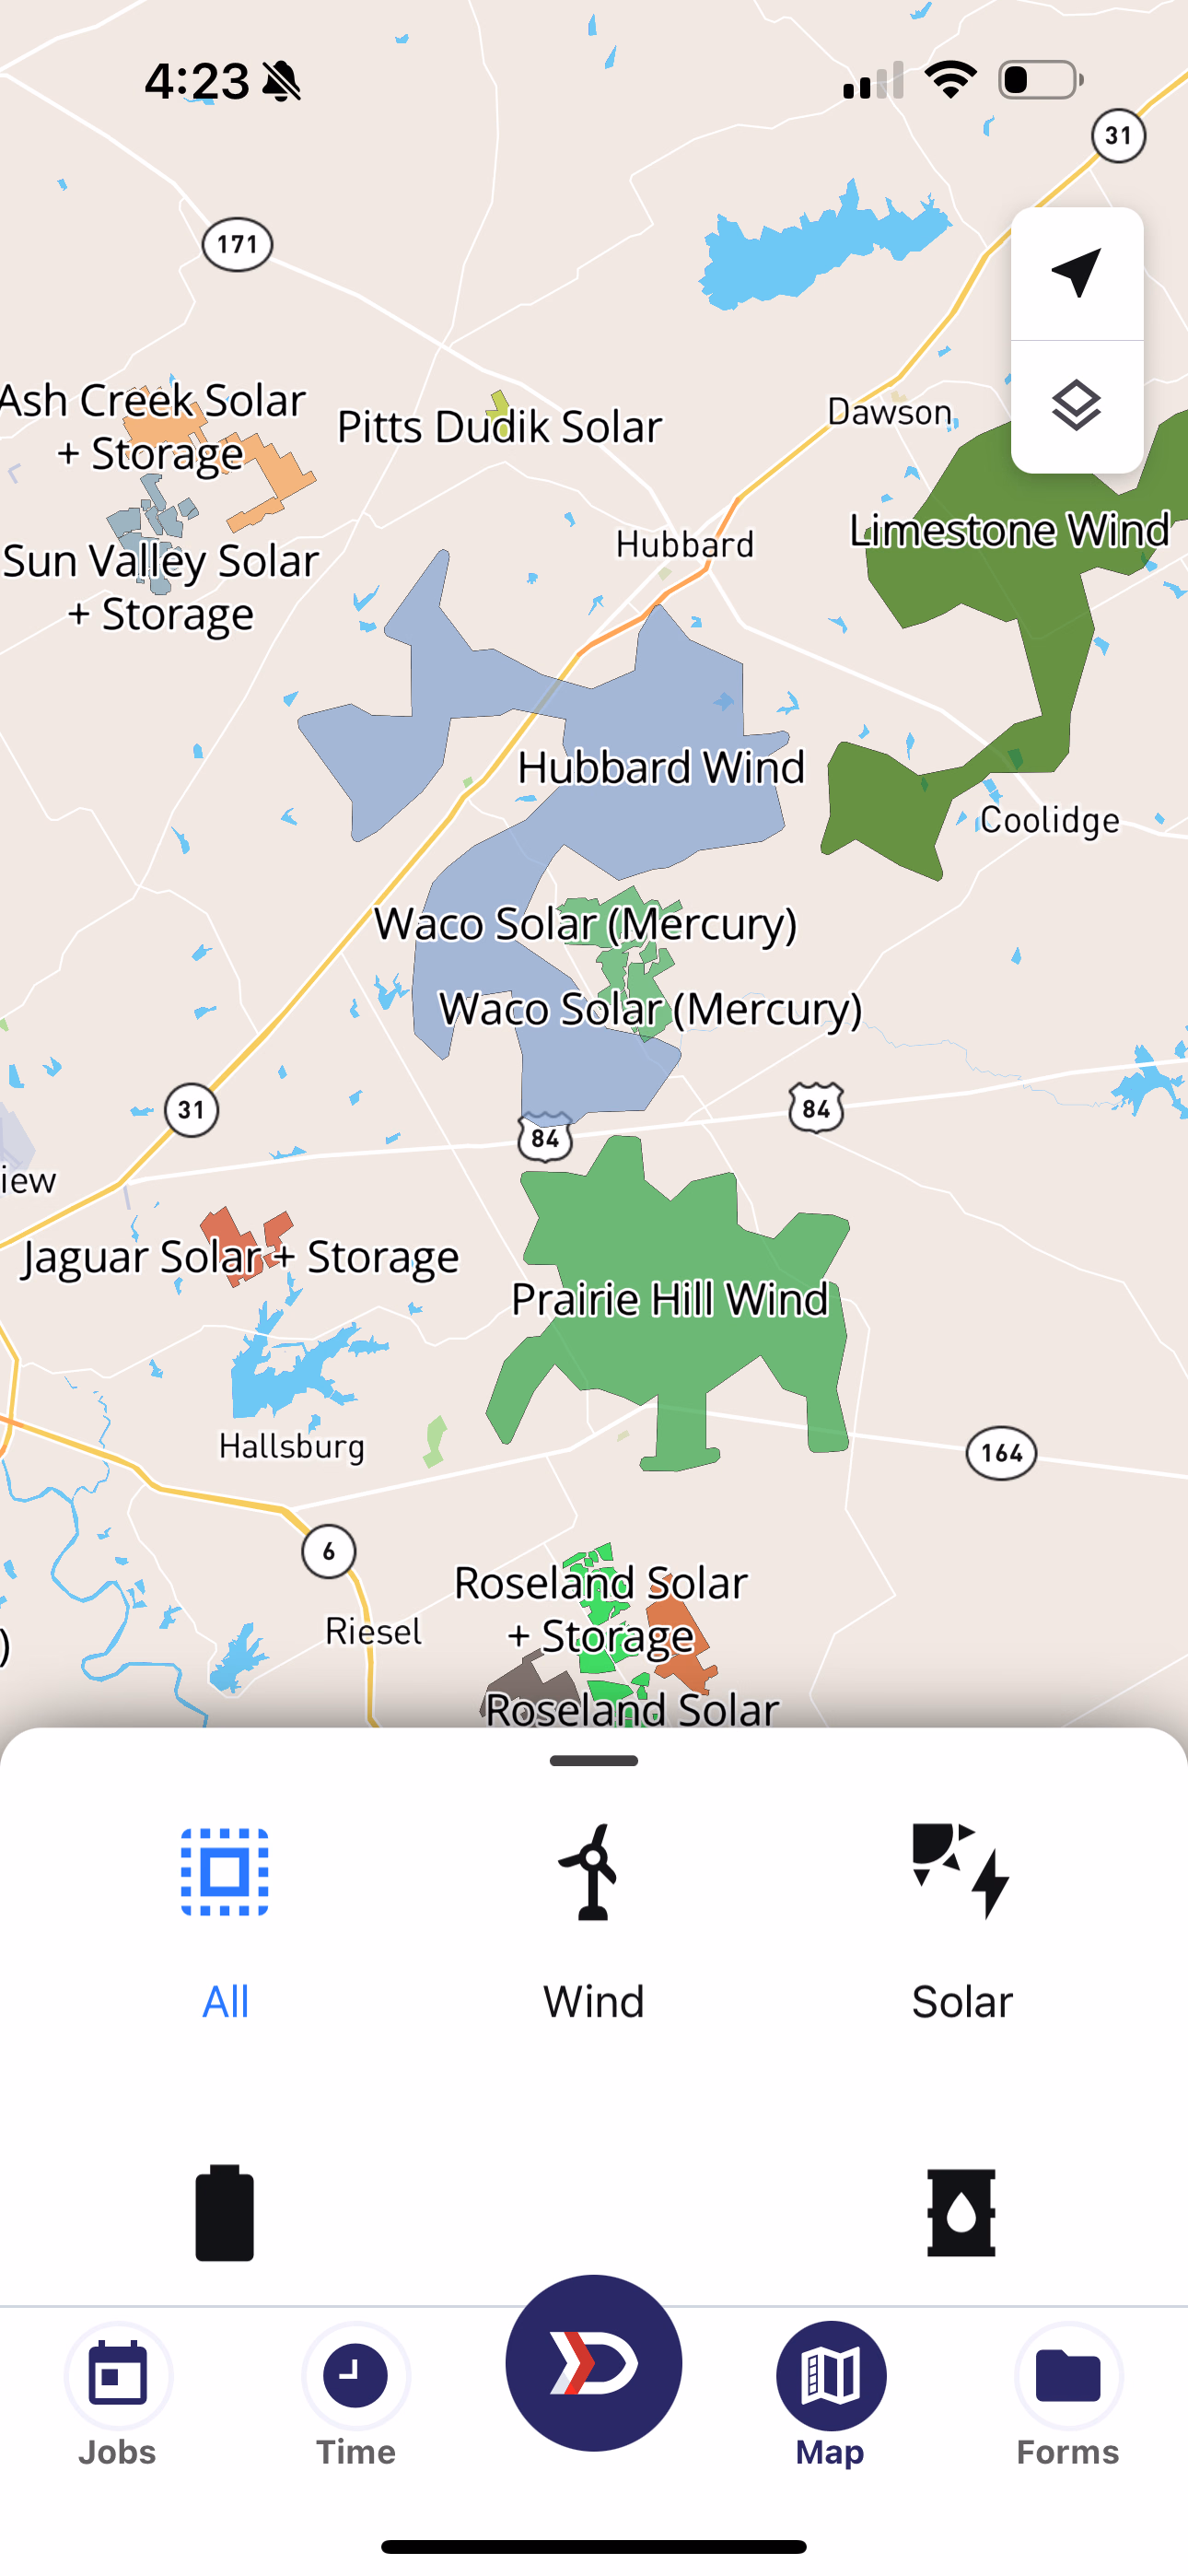
By default, all sites appear on the map
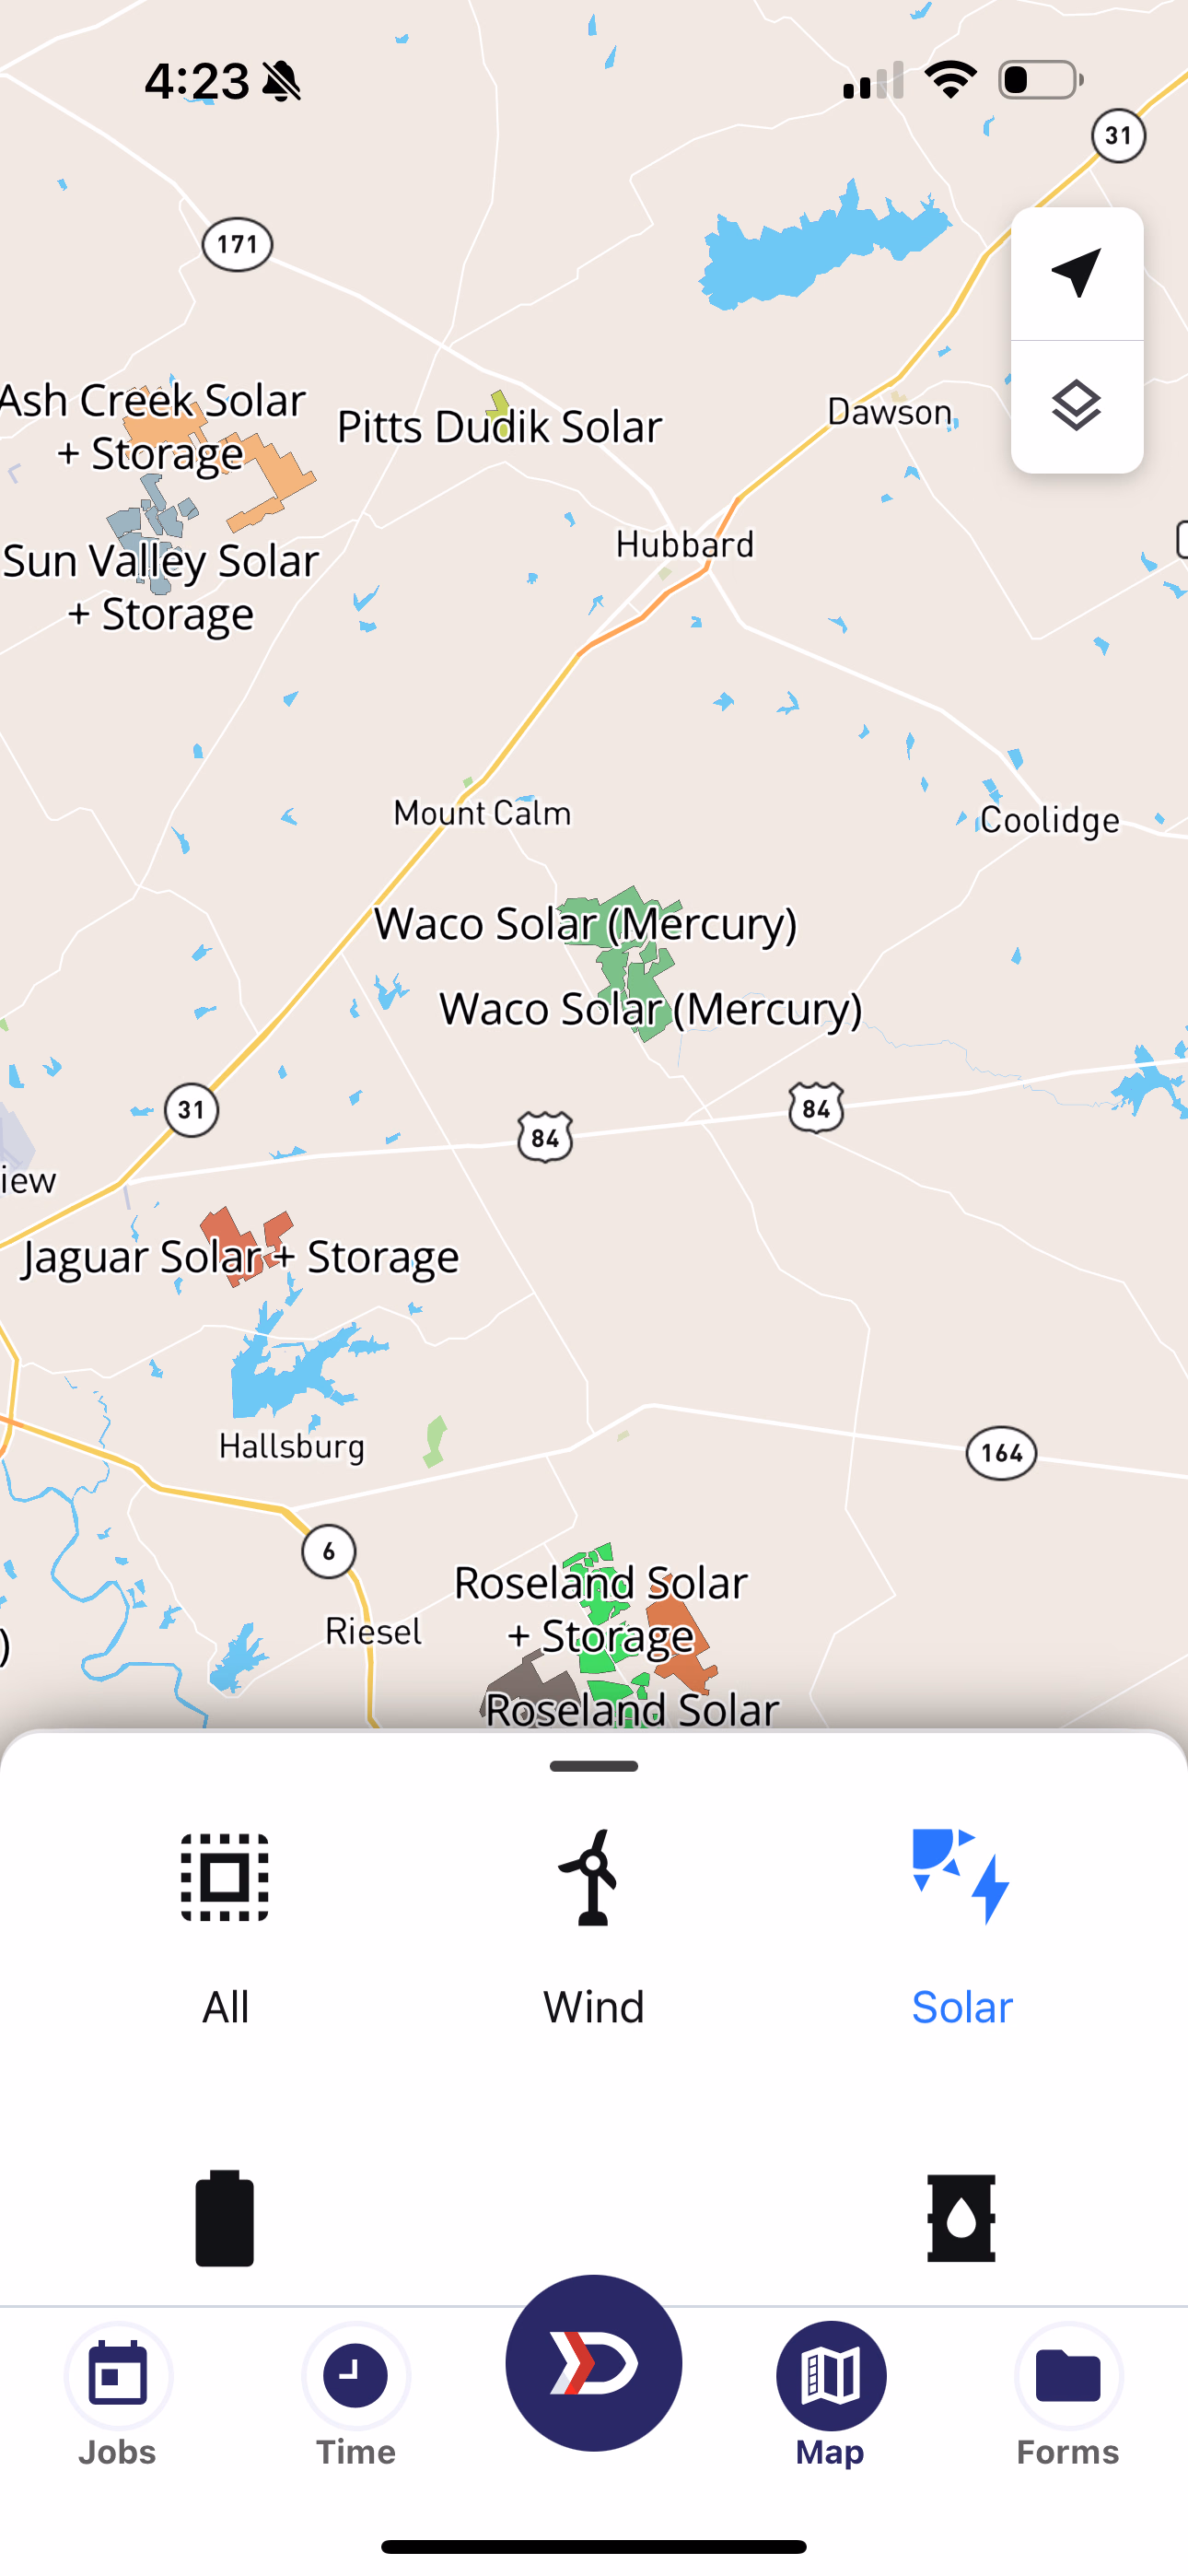
Filtering to Solar sites removes other site types such as Wind
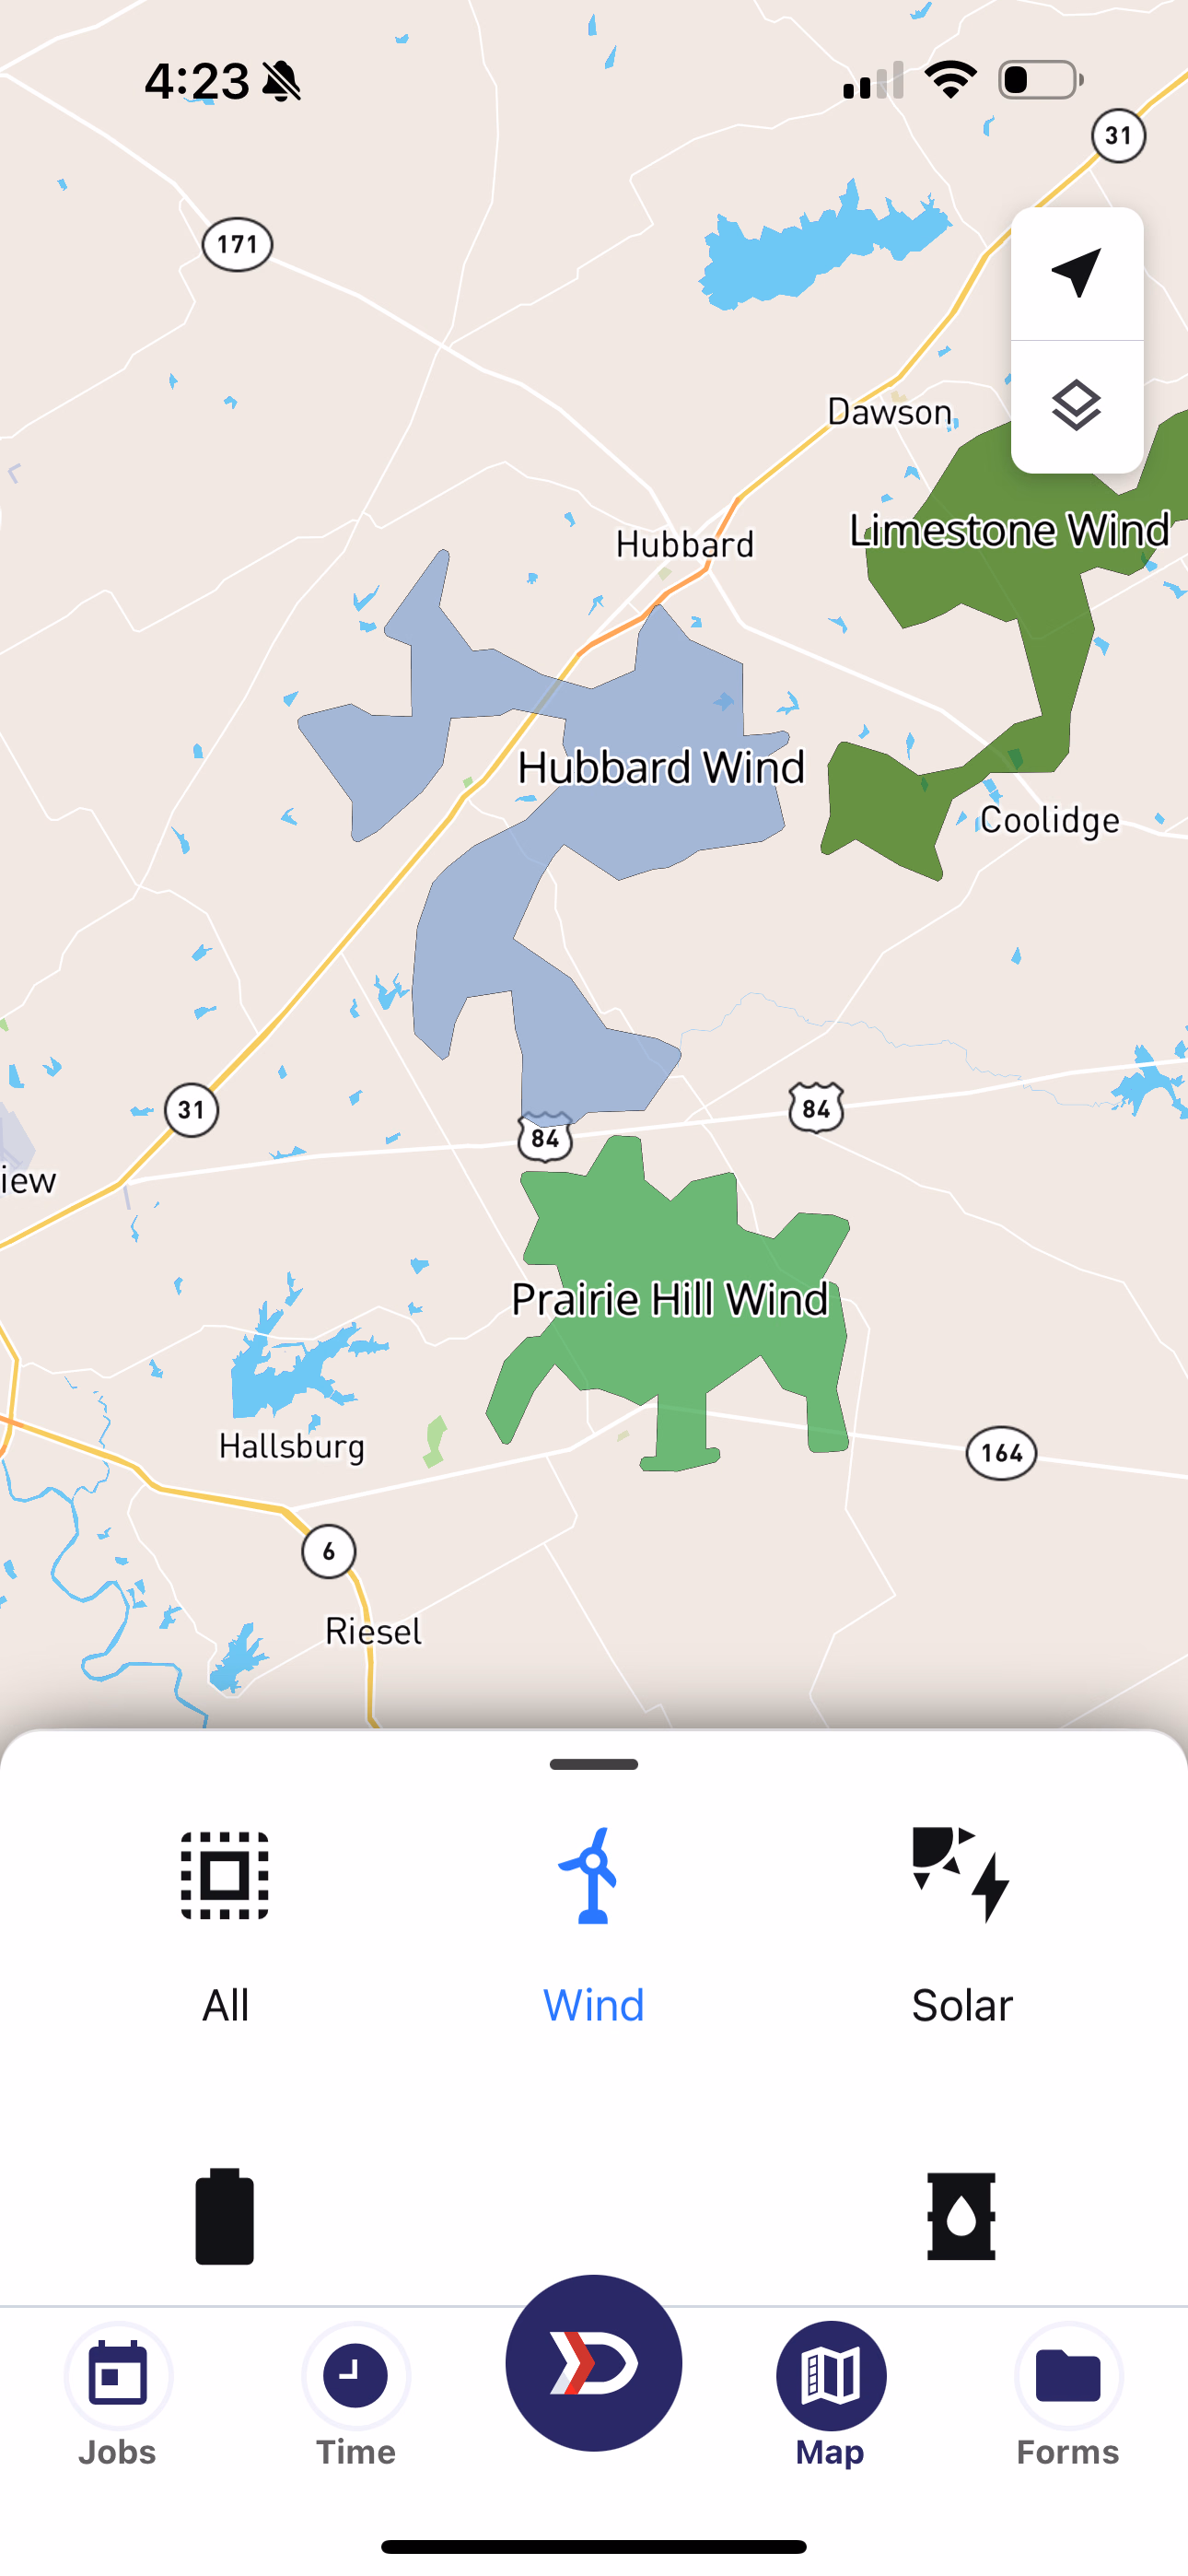
Filtering to just Wind sites removes the Solar sites
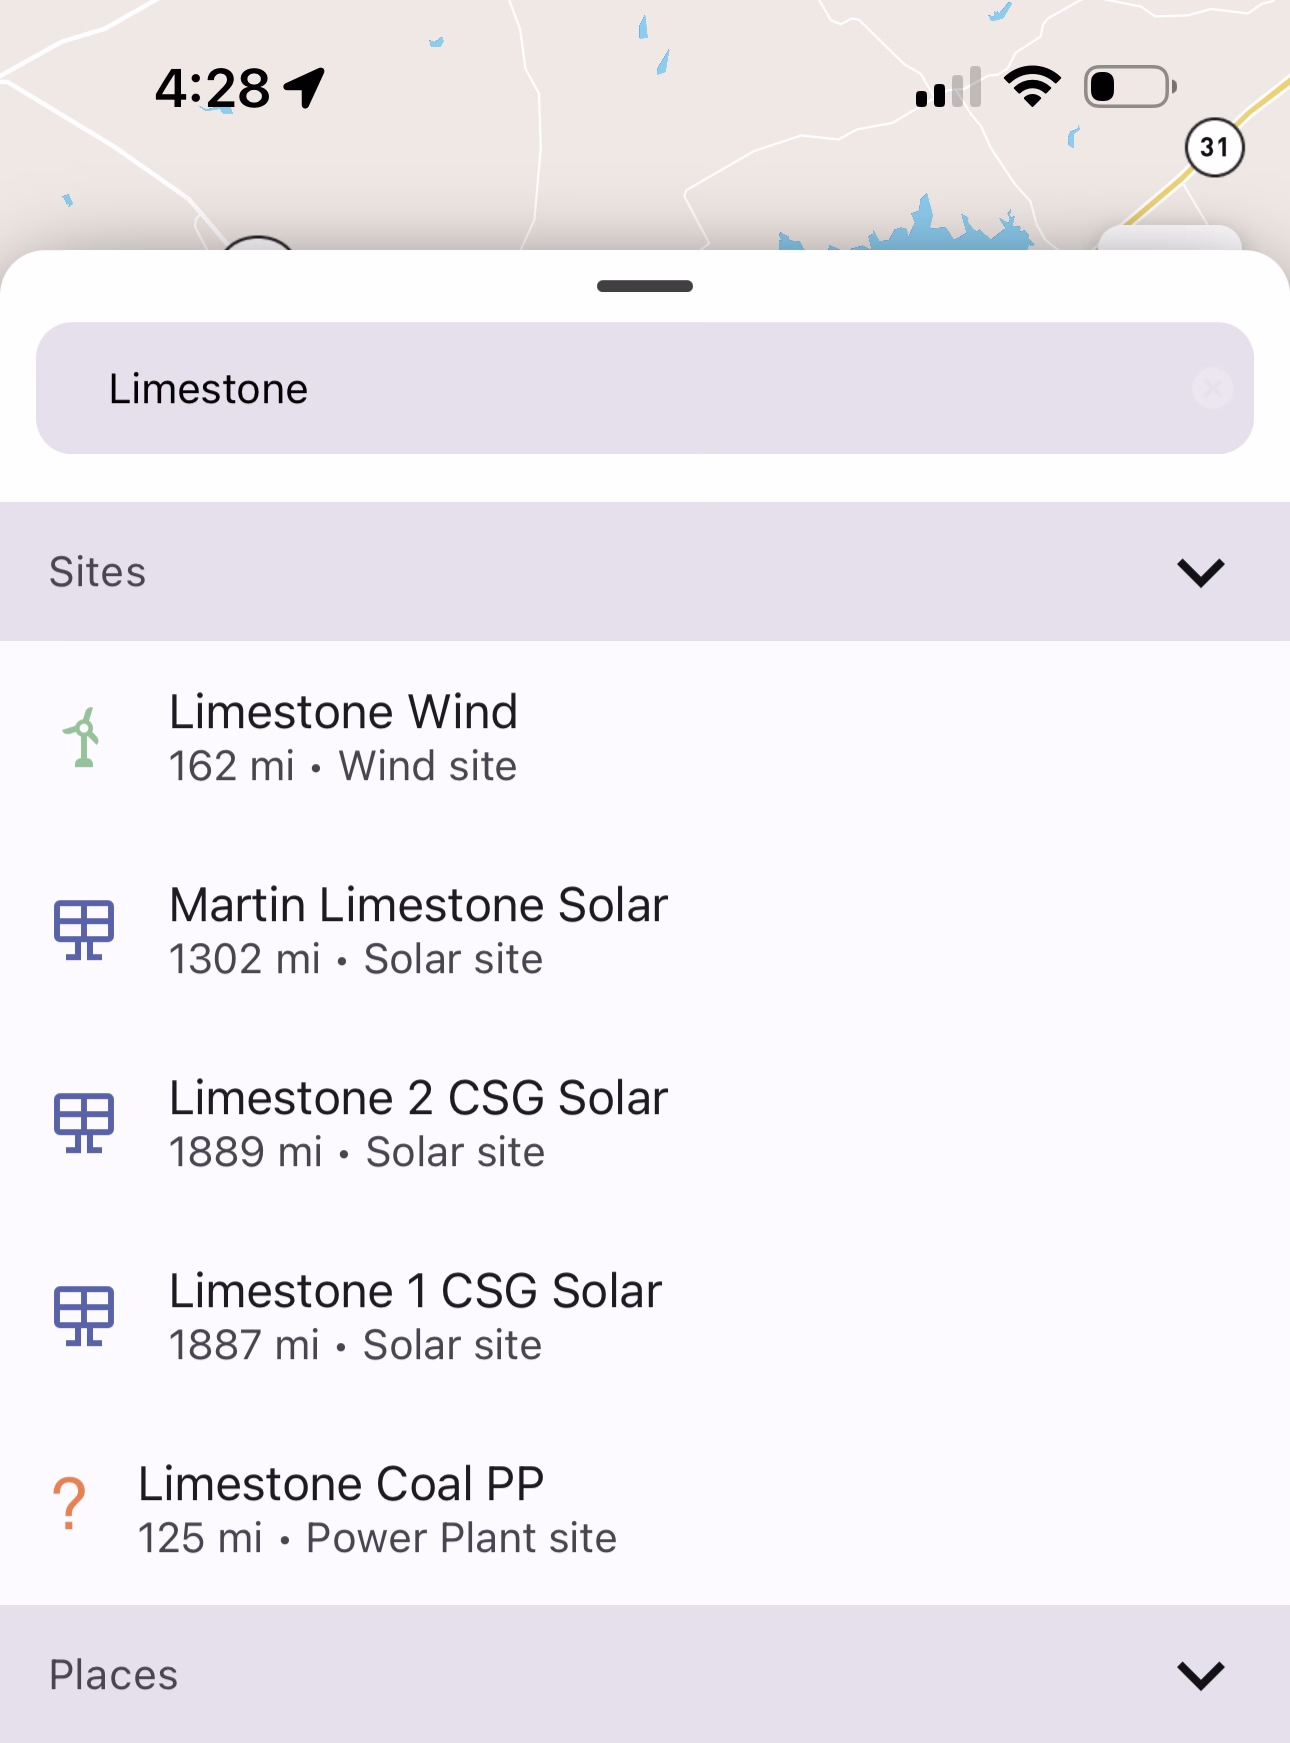
Site Type Filters also apply to search:
Search when "All" sites selected
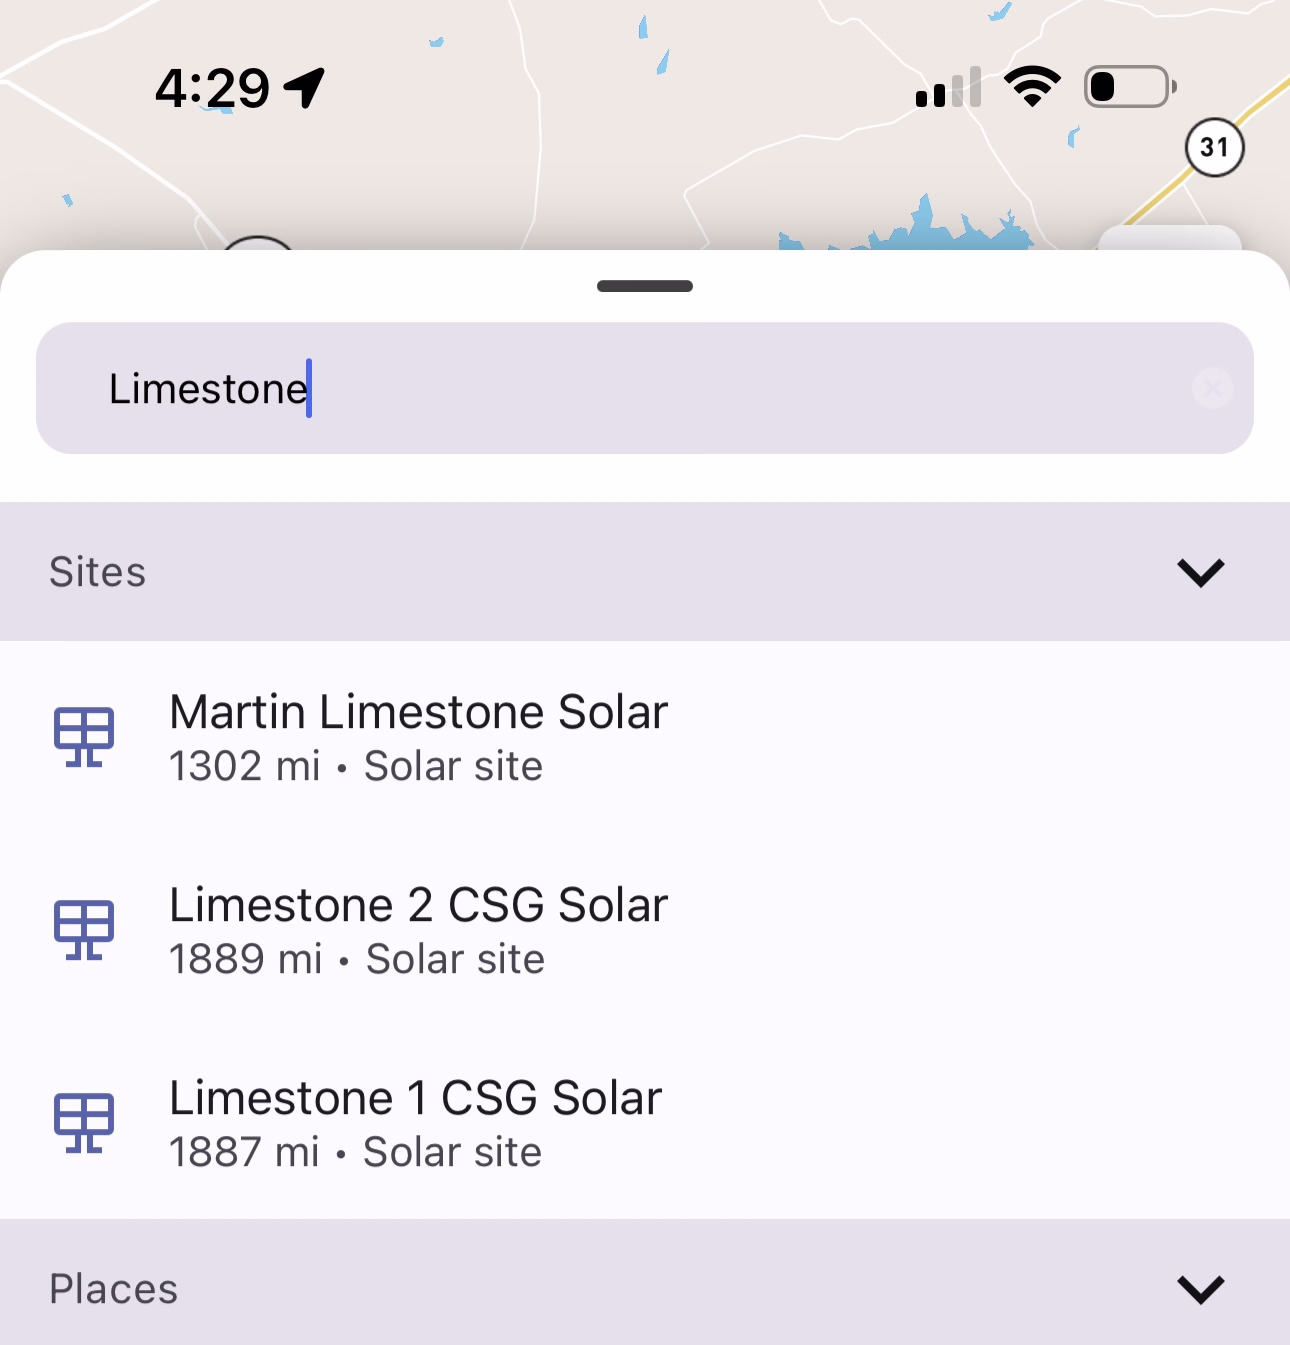
Search when Site Type is only Solar
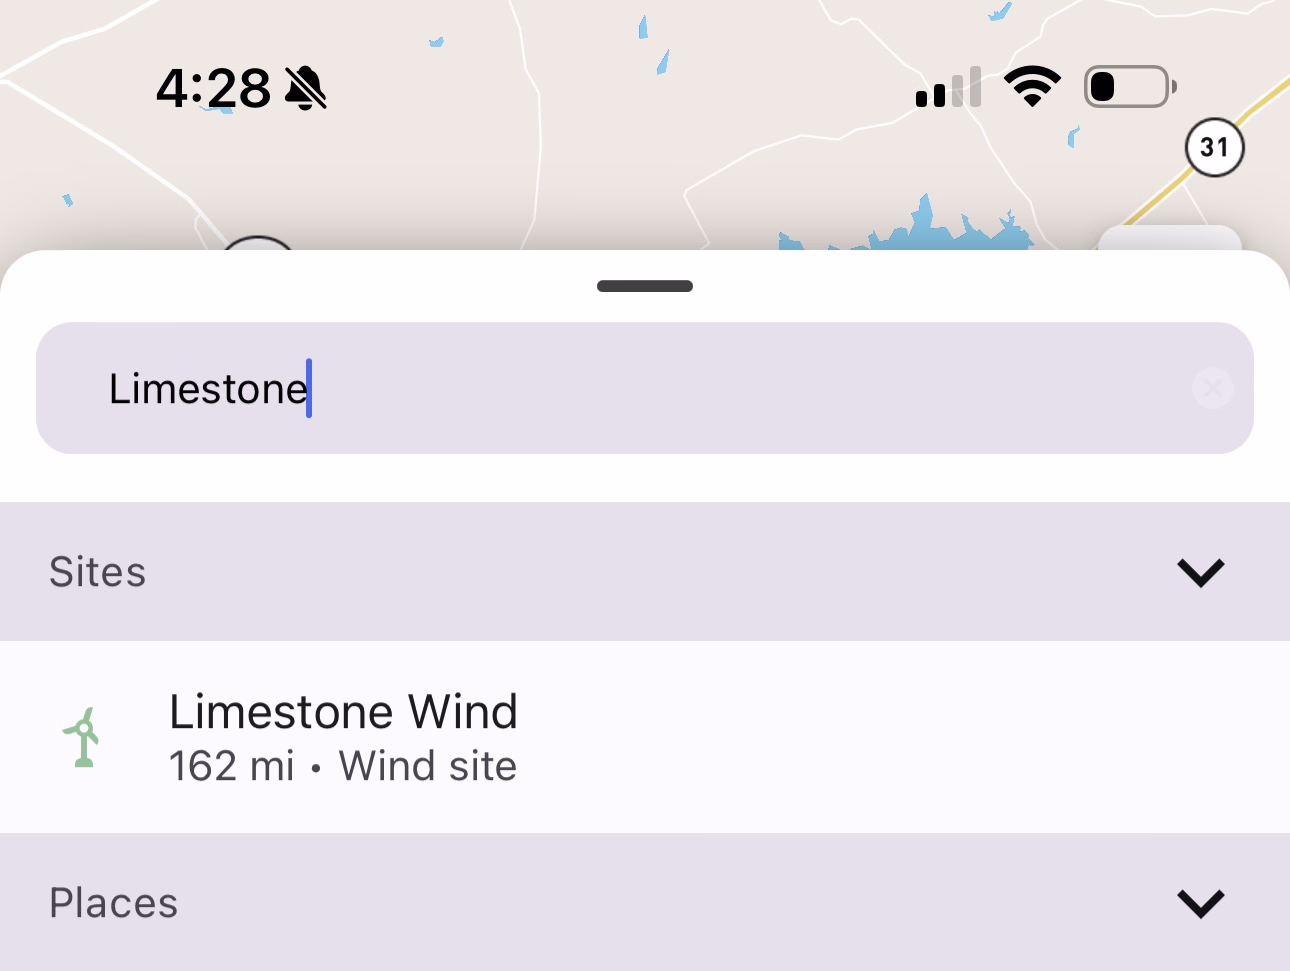
Search when Site Type is only Wind
Weather Layer
Weather Layer is a non-interactive way to display weather conditions on the map. When a Weather Layer is selected, you can still search and click on locations. The colors and Icons displayed by a Weather Layer provide information as to current weather conditions.
To remove a selected Weather Layer, tap on the Weather Layer highlighted in blue.
Relevant Weather Layers are:
- Air Temperature
- Relative Humidity
- Cloudiness
- Accumulated Precipitation
- Precipitation Intensity
- Wind Speed & Direction
- Wind Speed
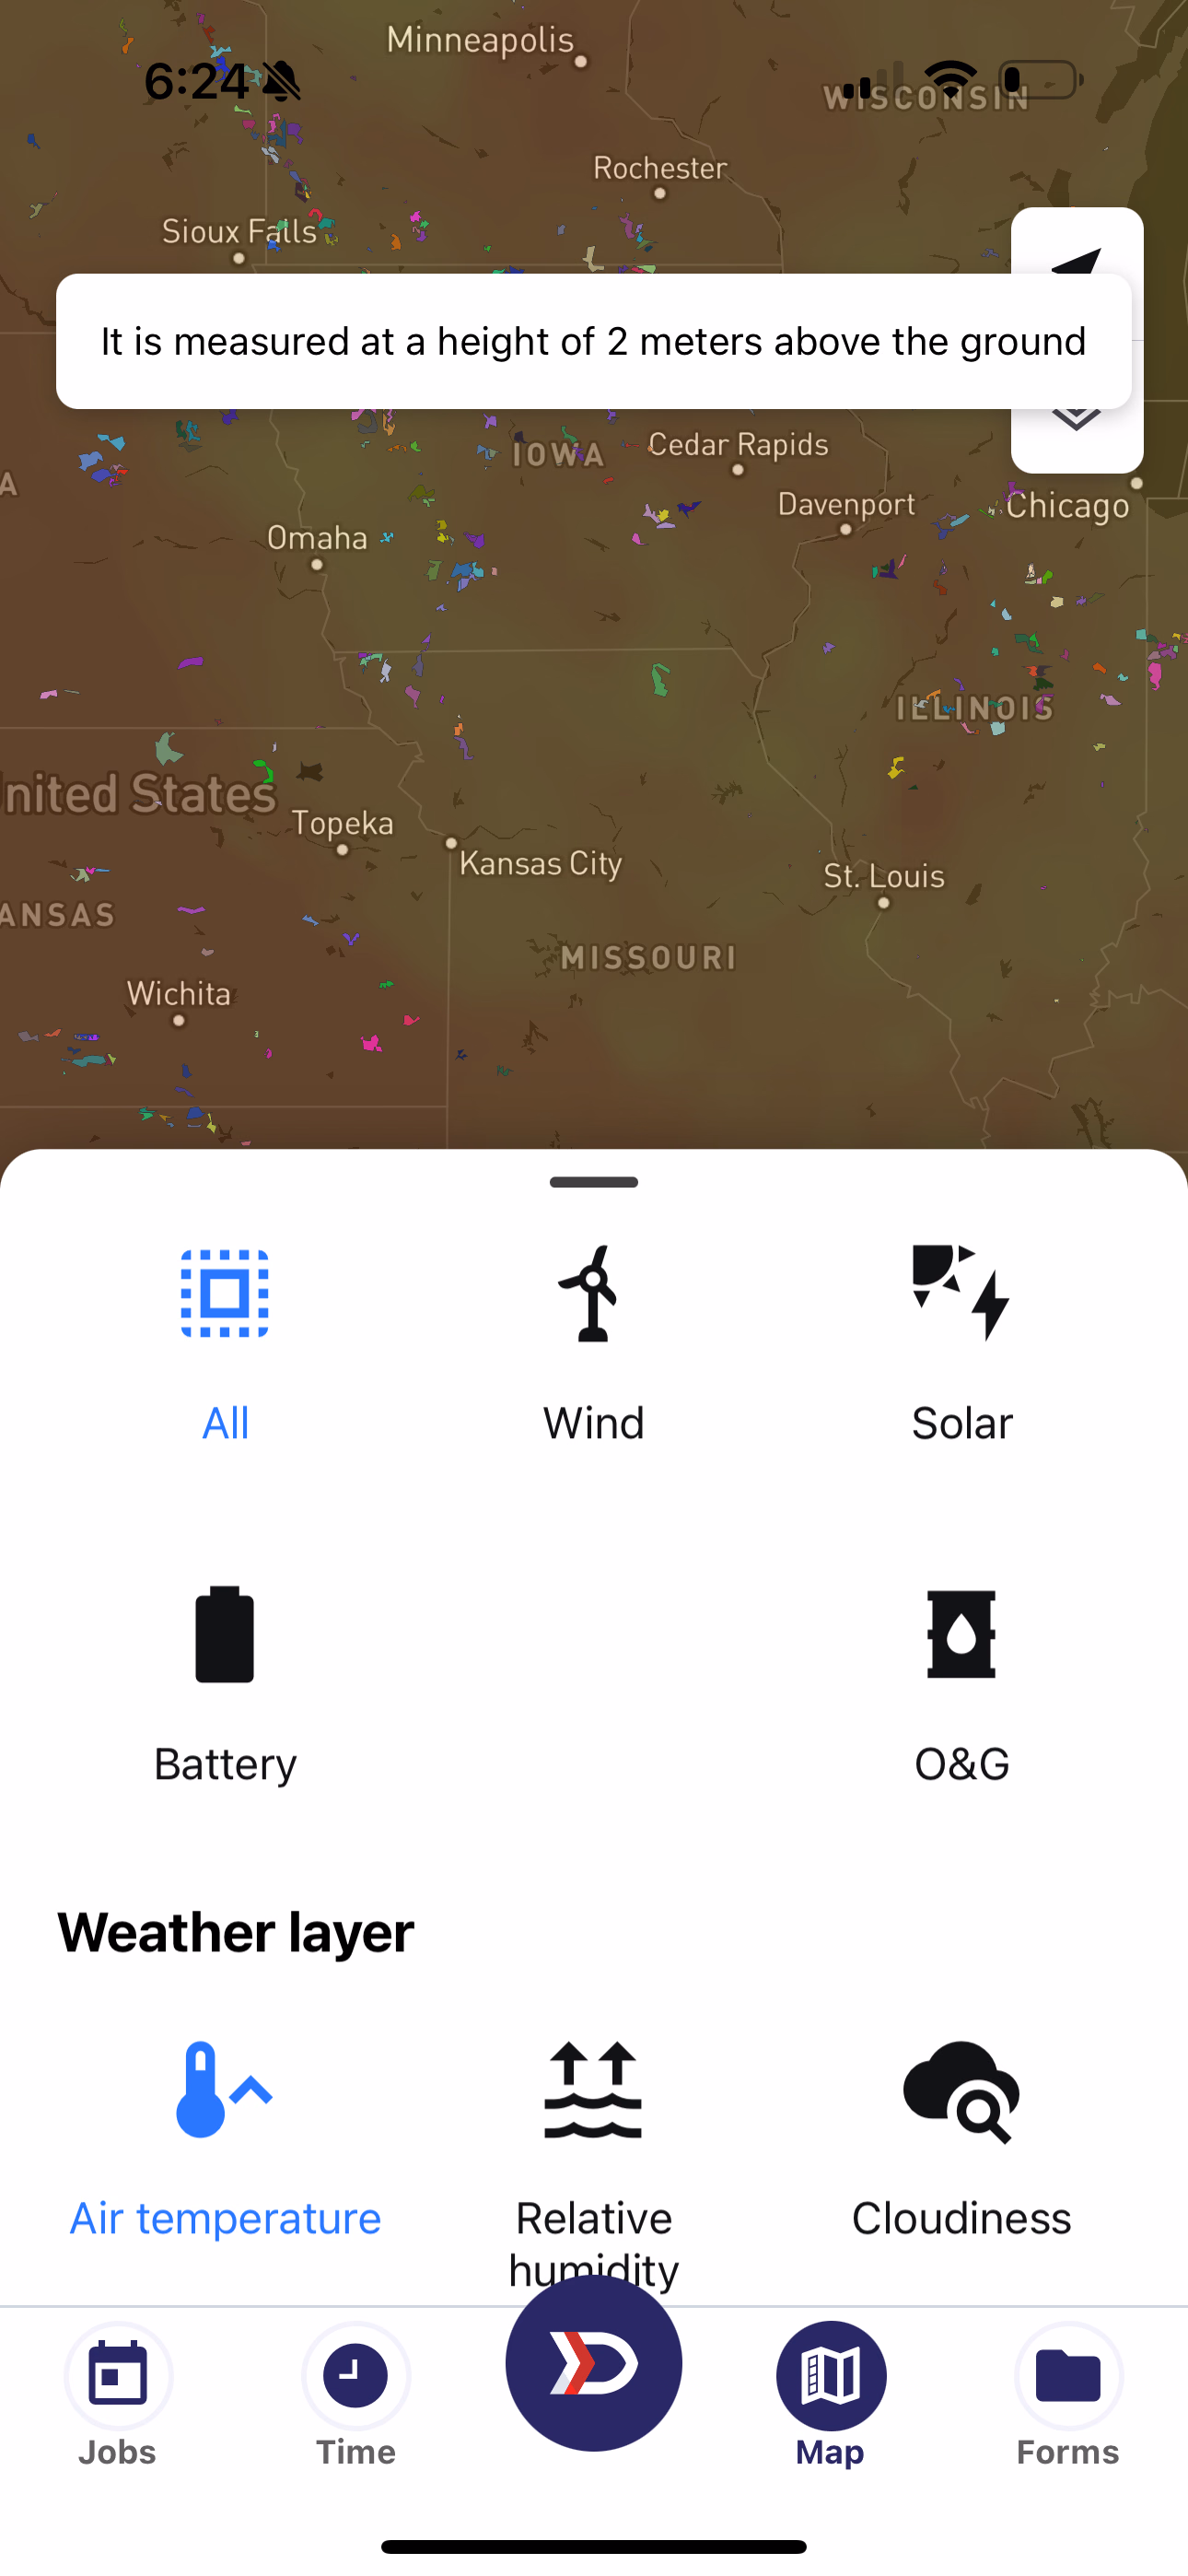
Red: Warmer, Green: Cooler Air Temperature
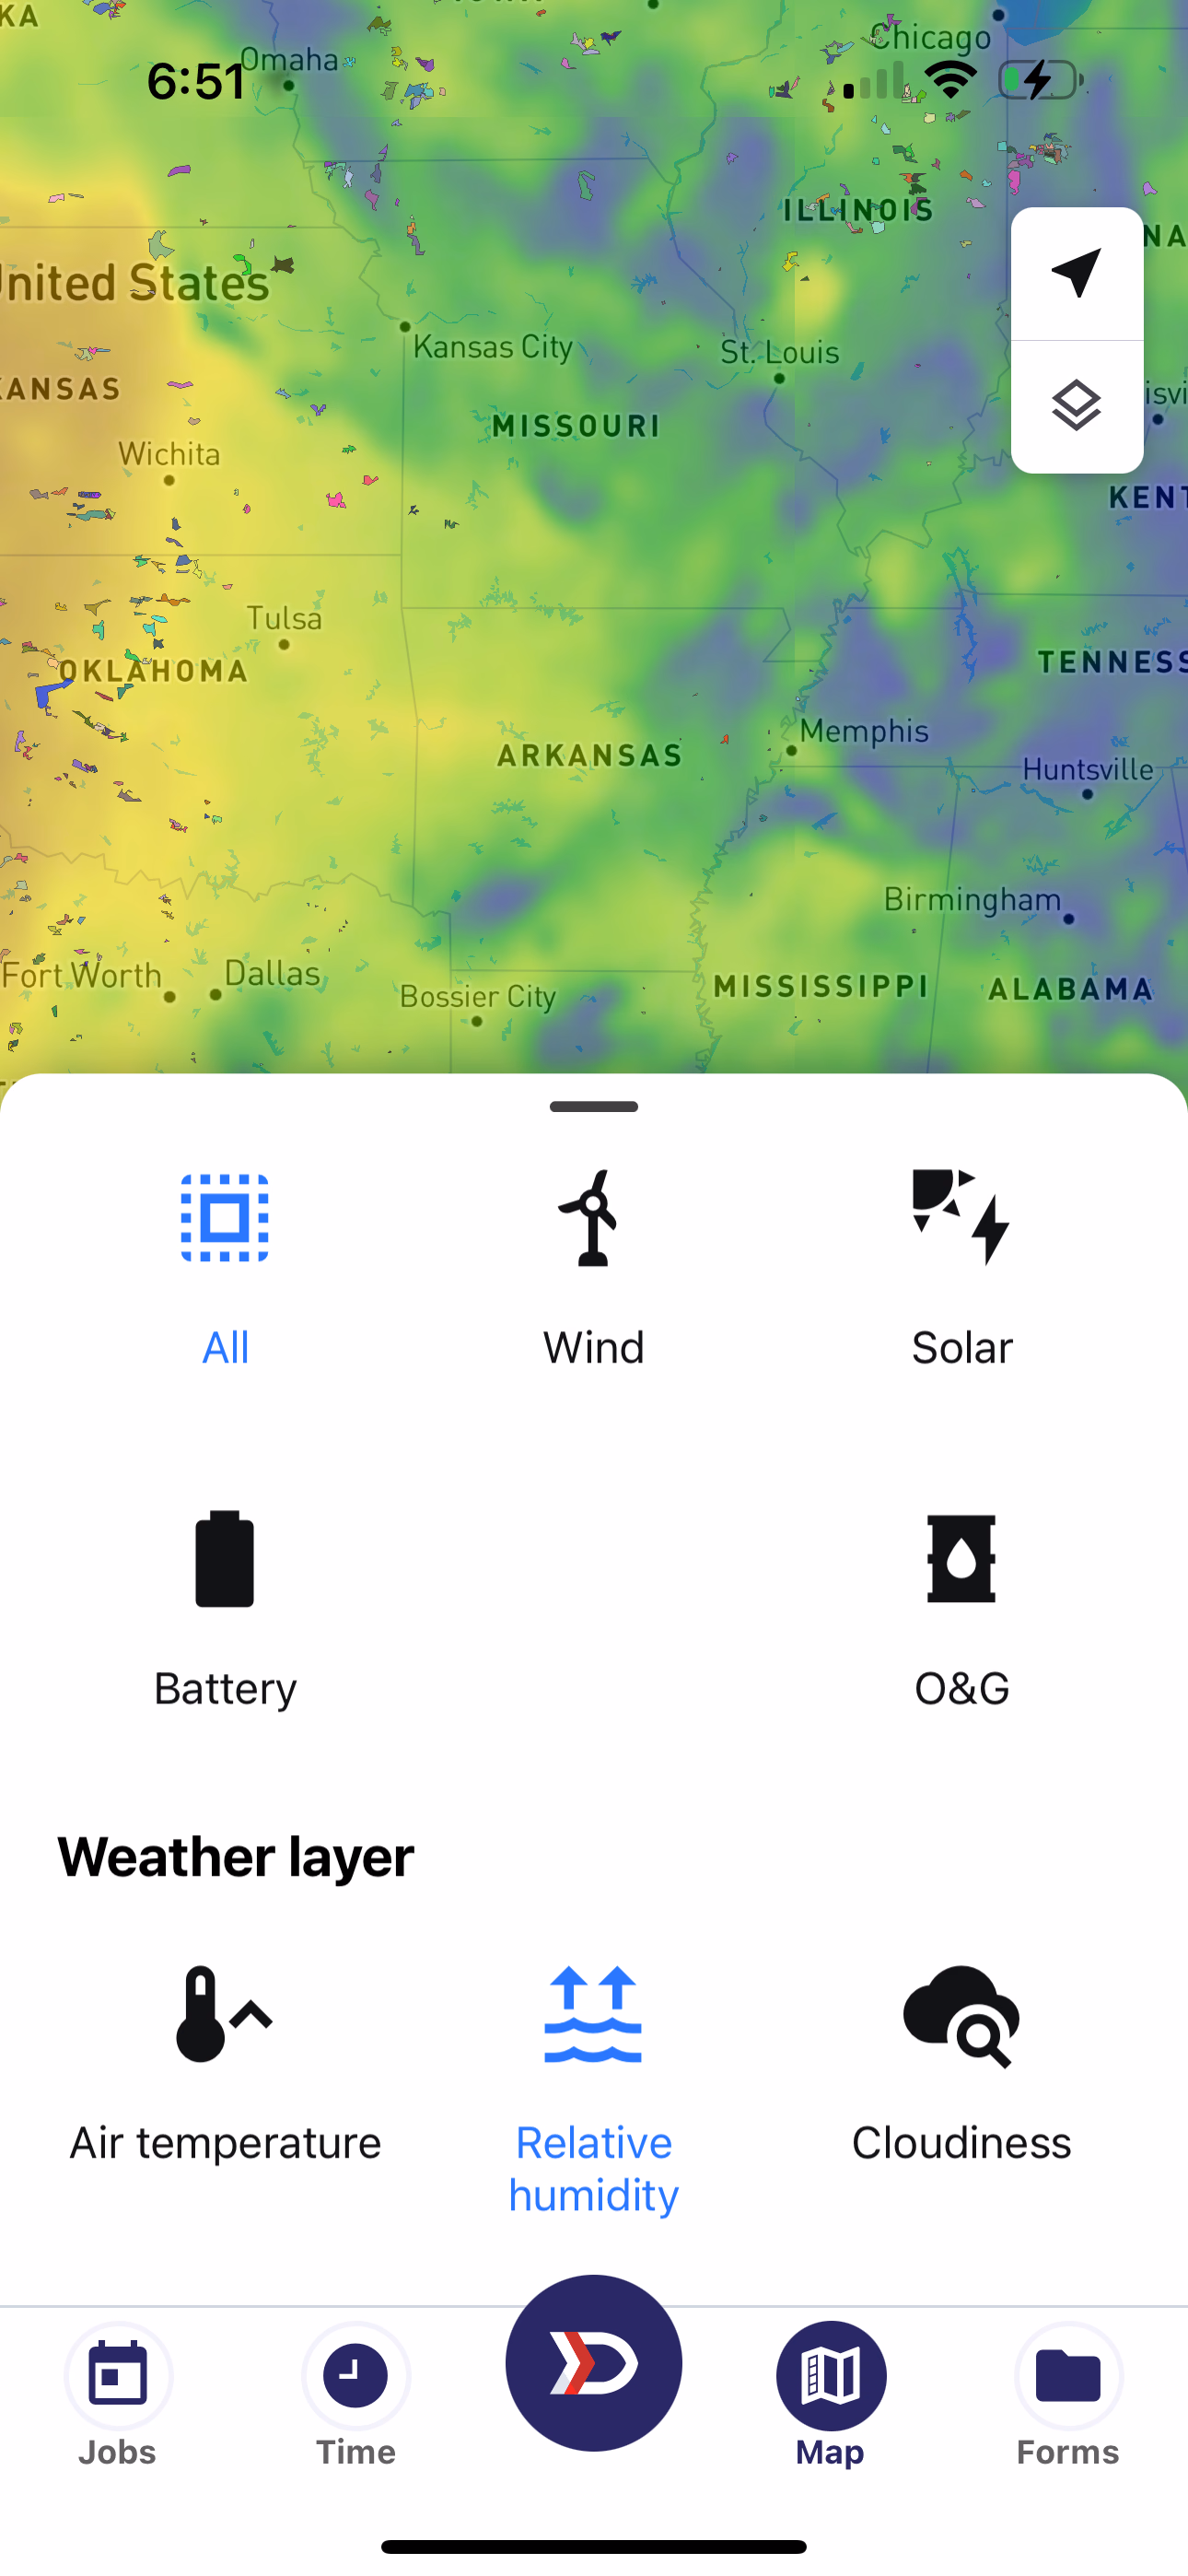
Blue: Wettest, Red: Driest
Grey Sections indicate Cloudiness
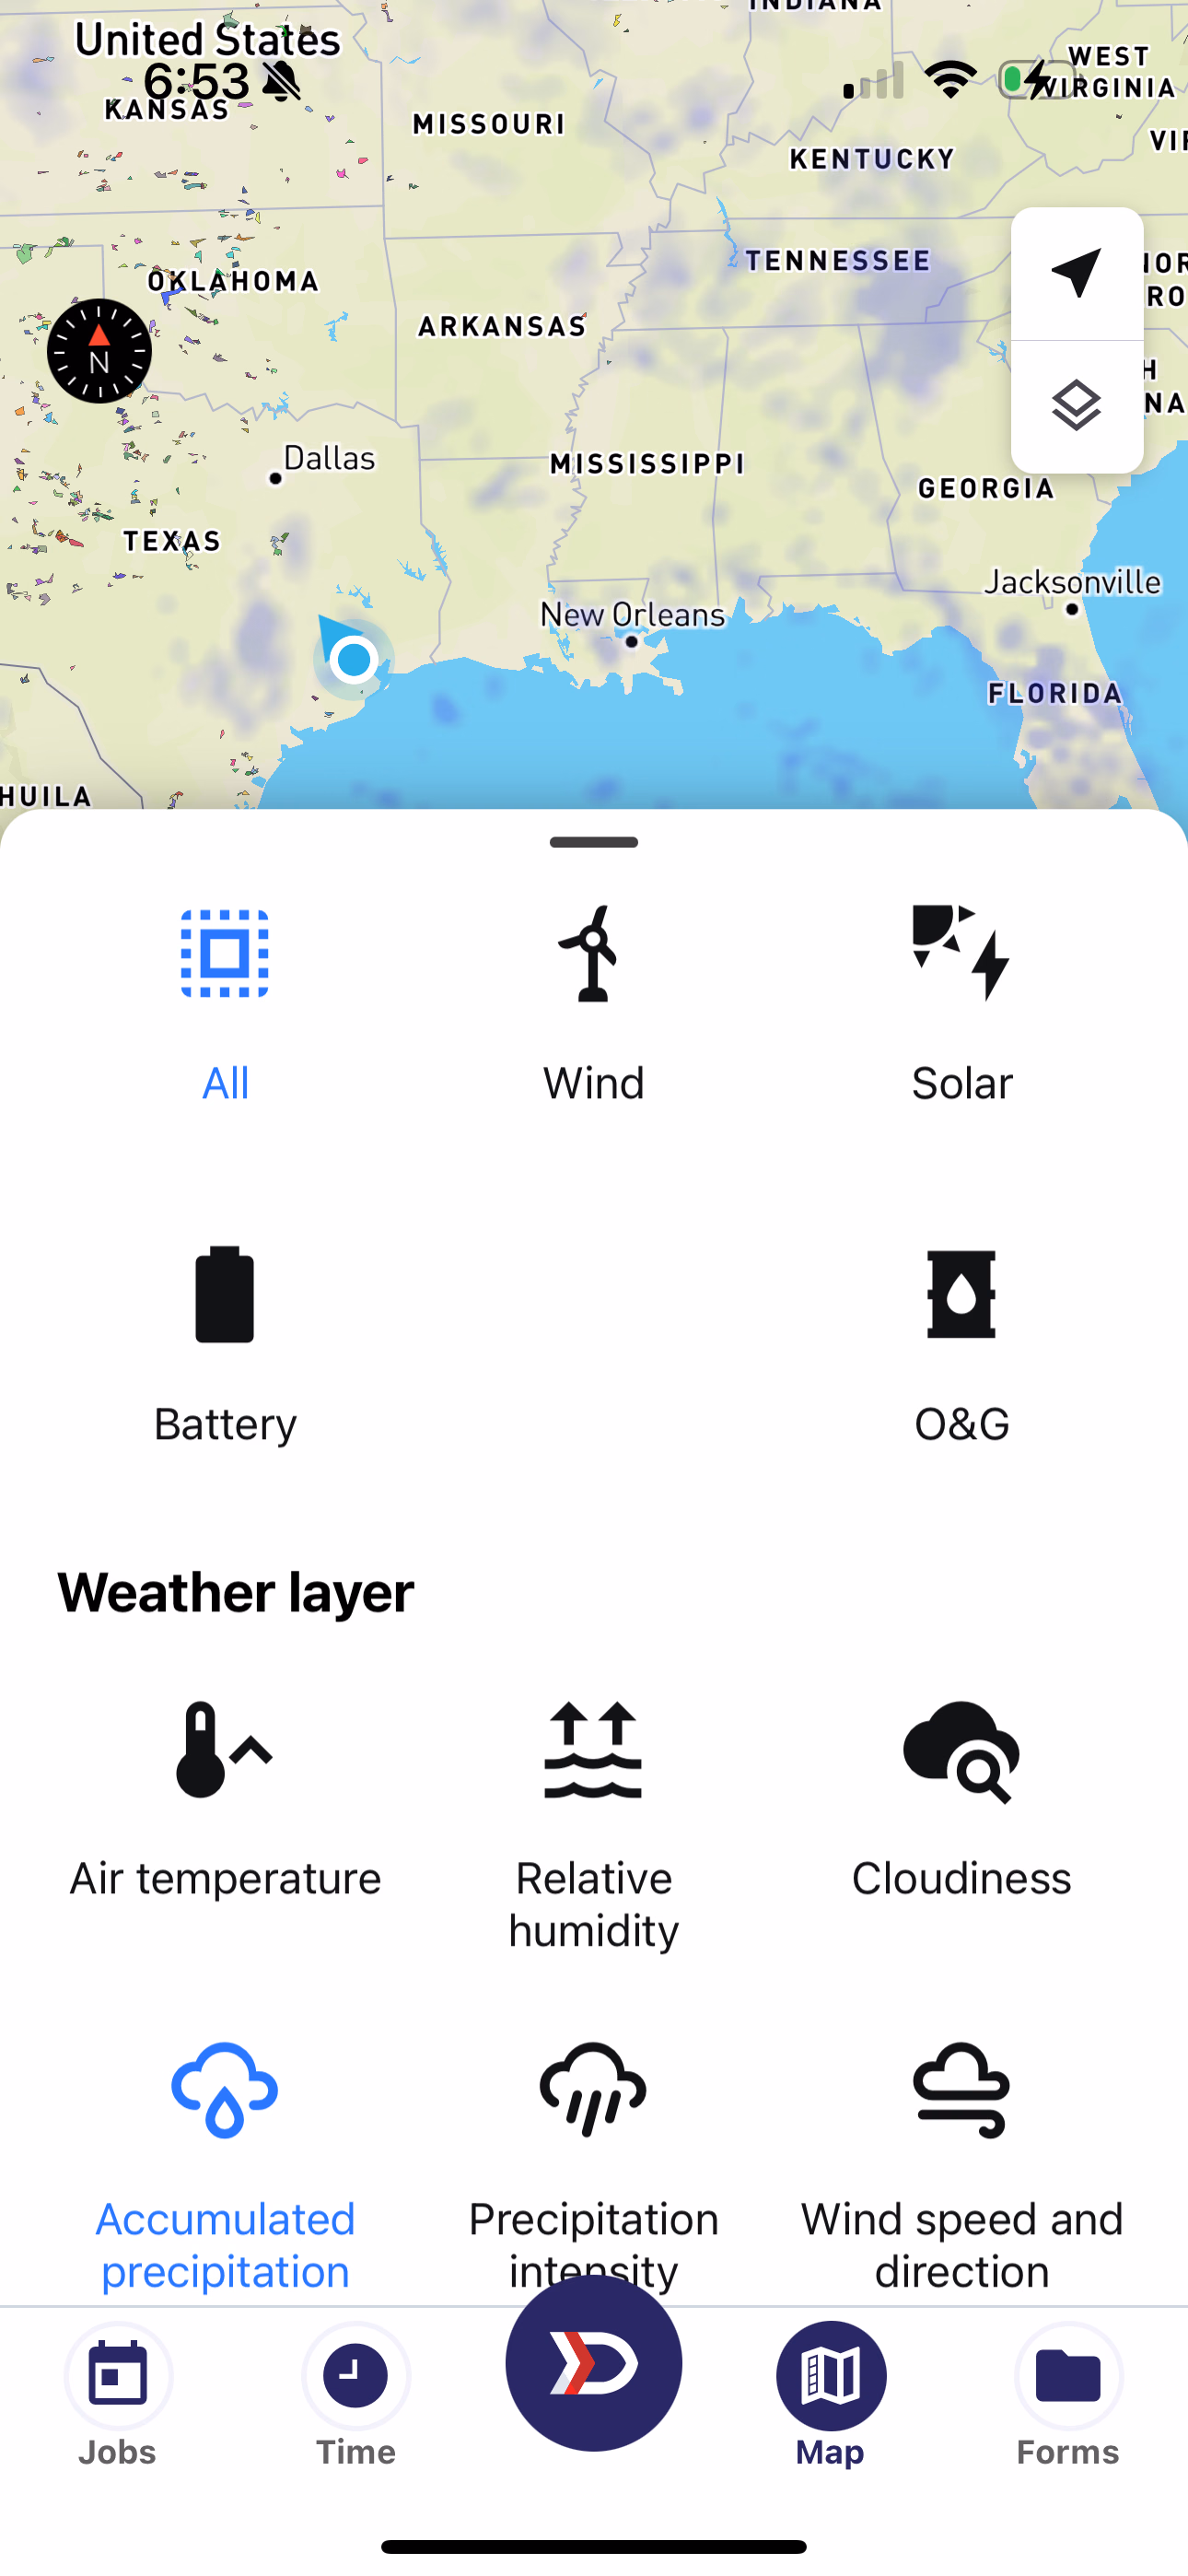
Violet indicates where precipitation has recently occurred
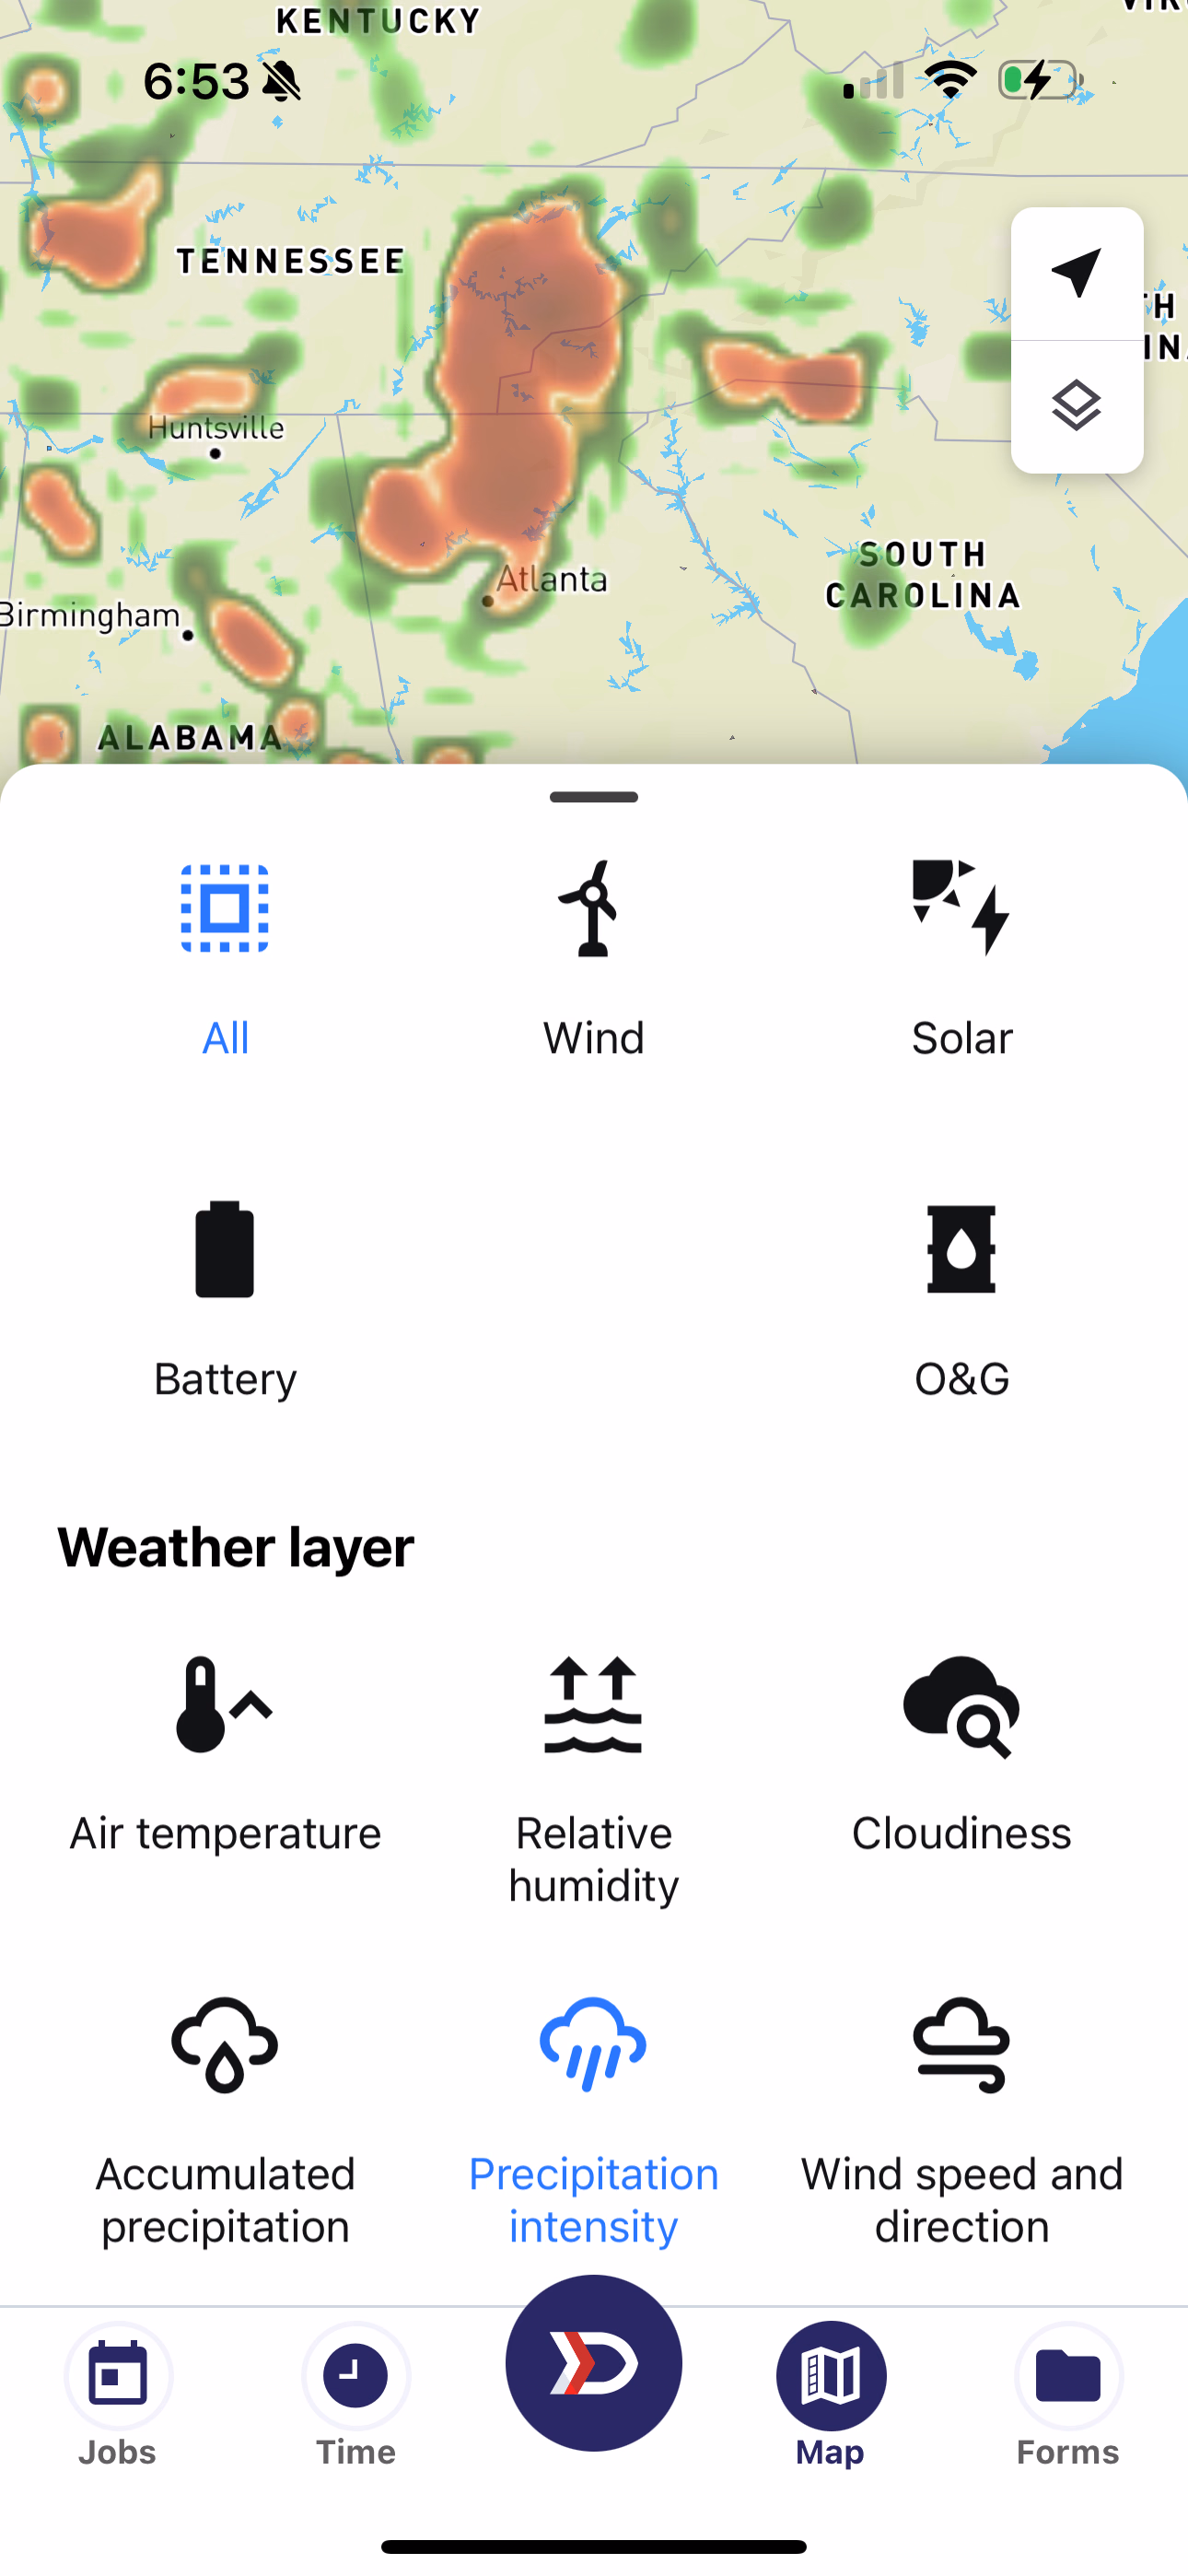
Red indicates heavy rain, Yellow indicates medium rain, Green indicates light rain
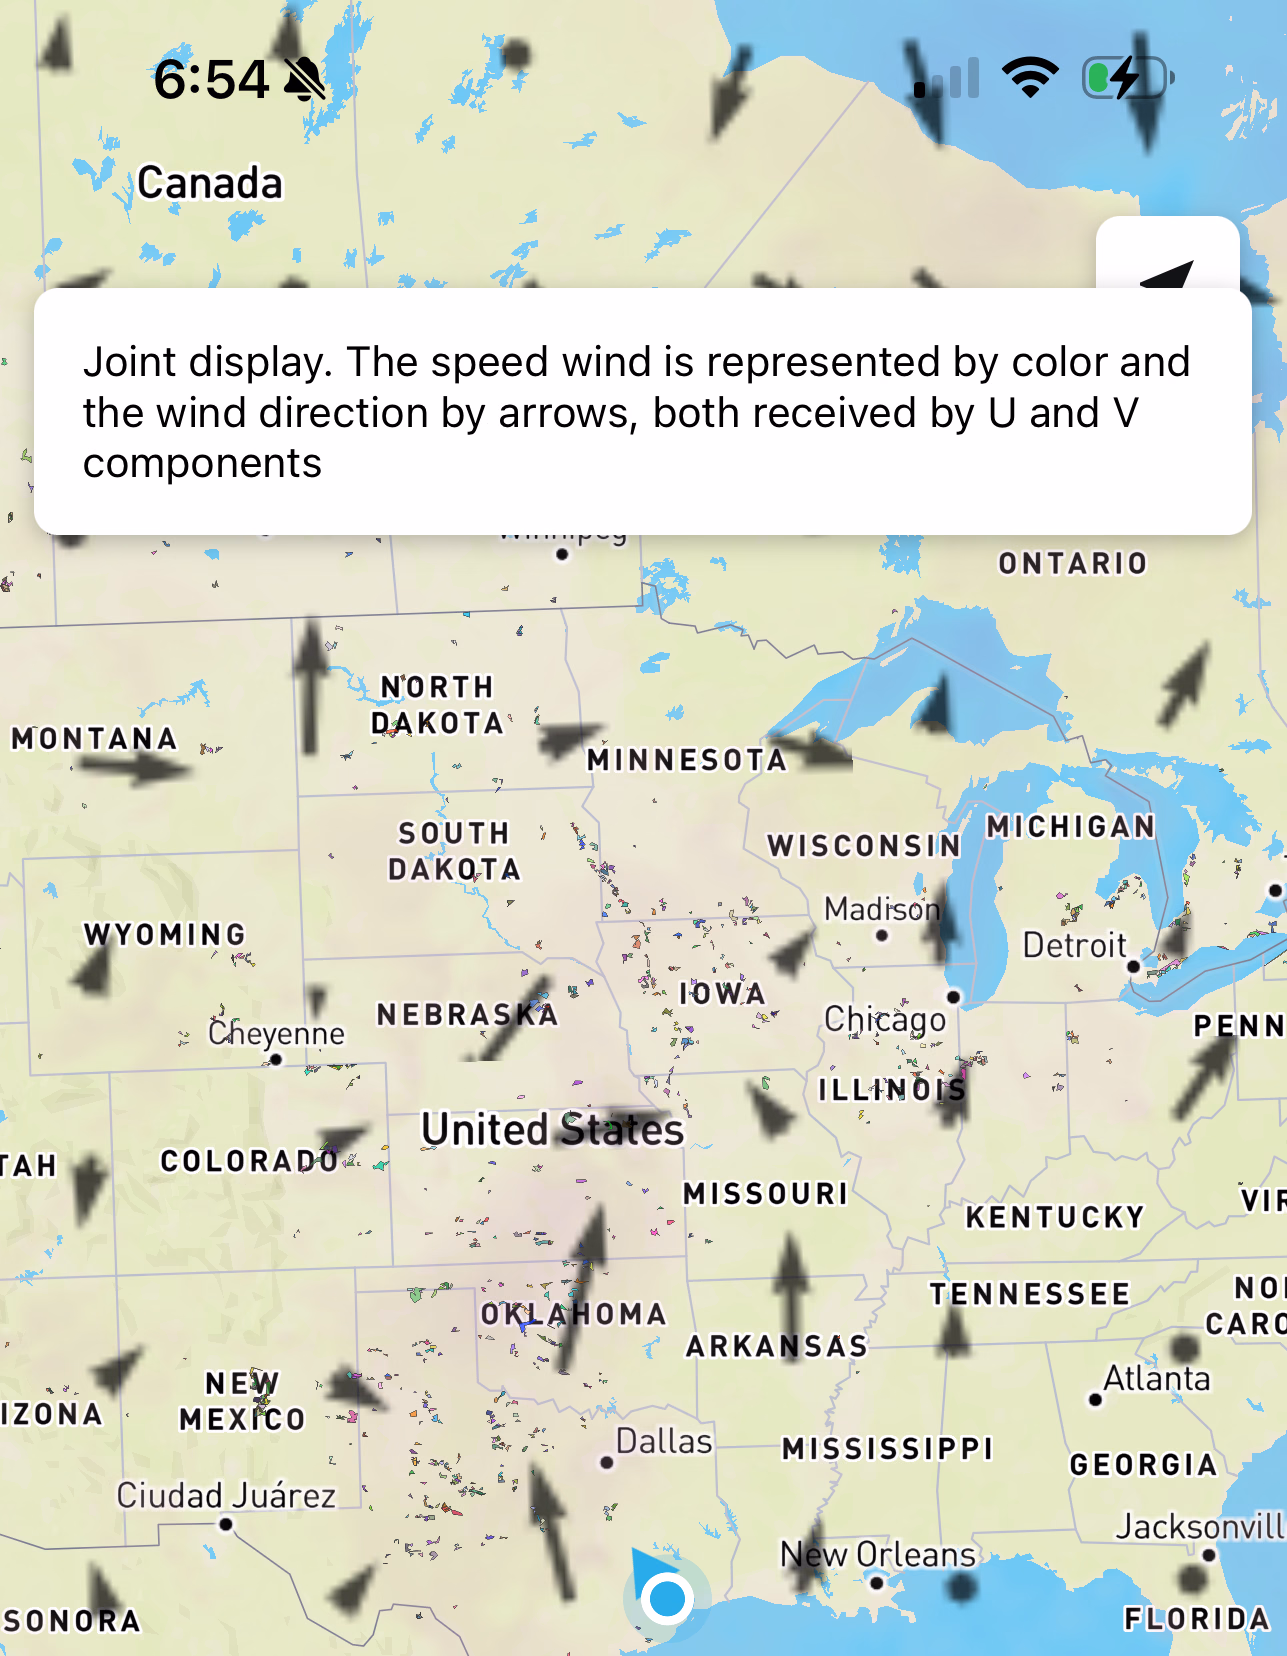
Wind Speed and Direction explination
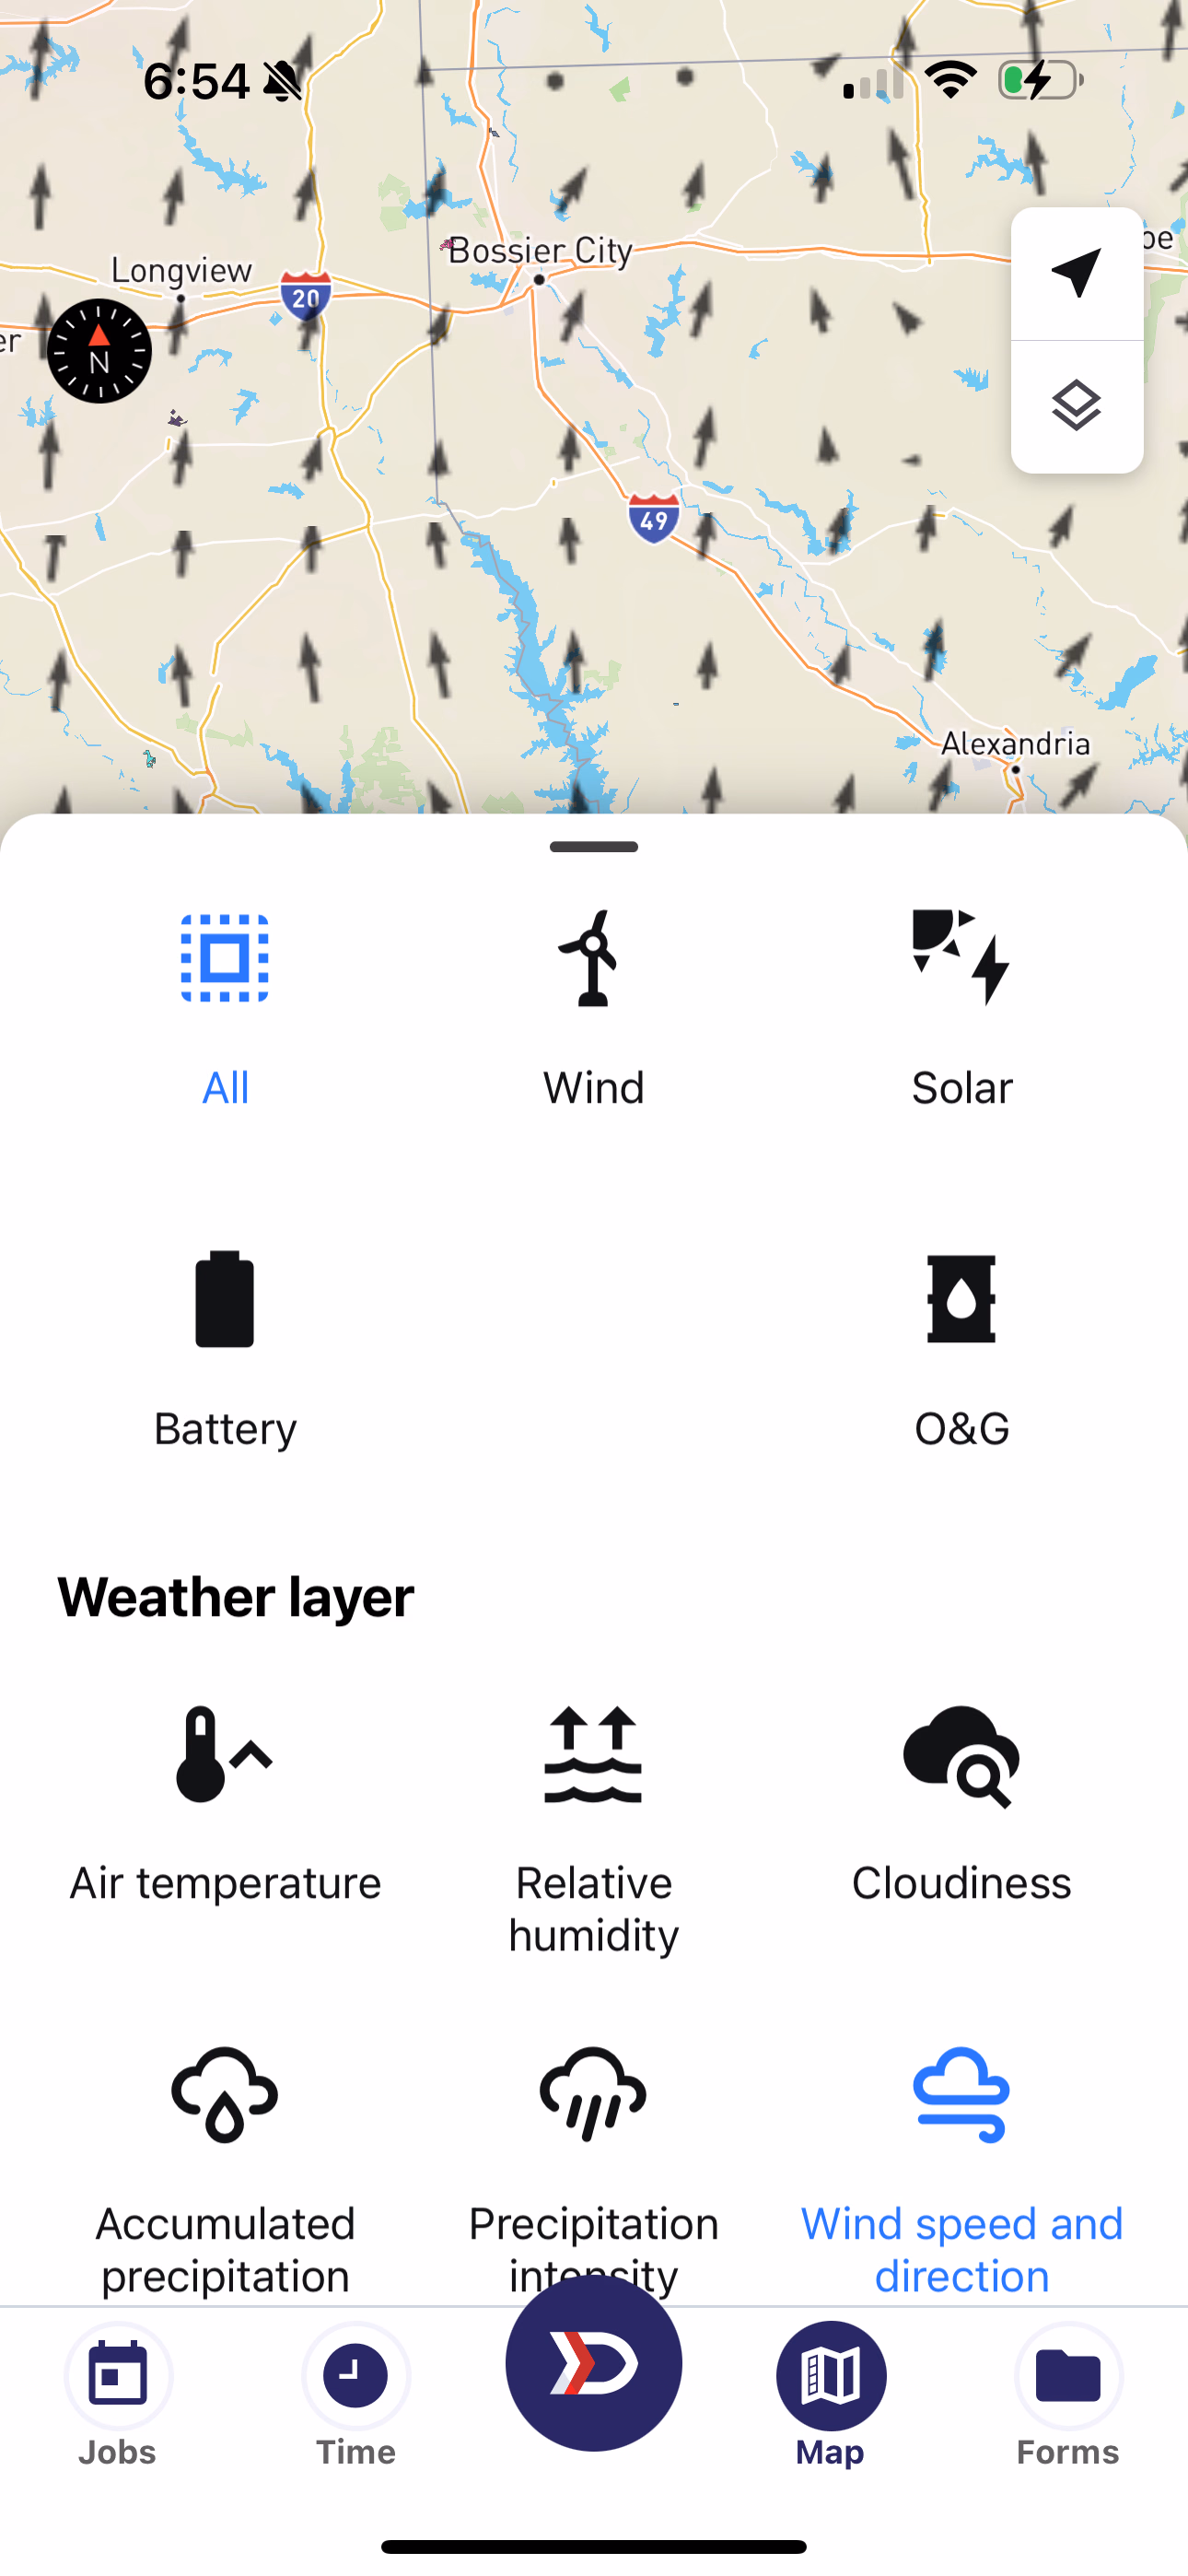
Bigger Arrows: more wind Direction: where wind is blowing
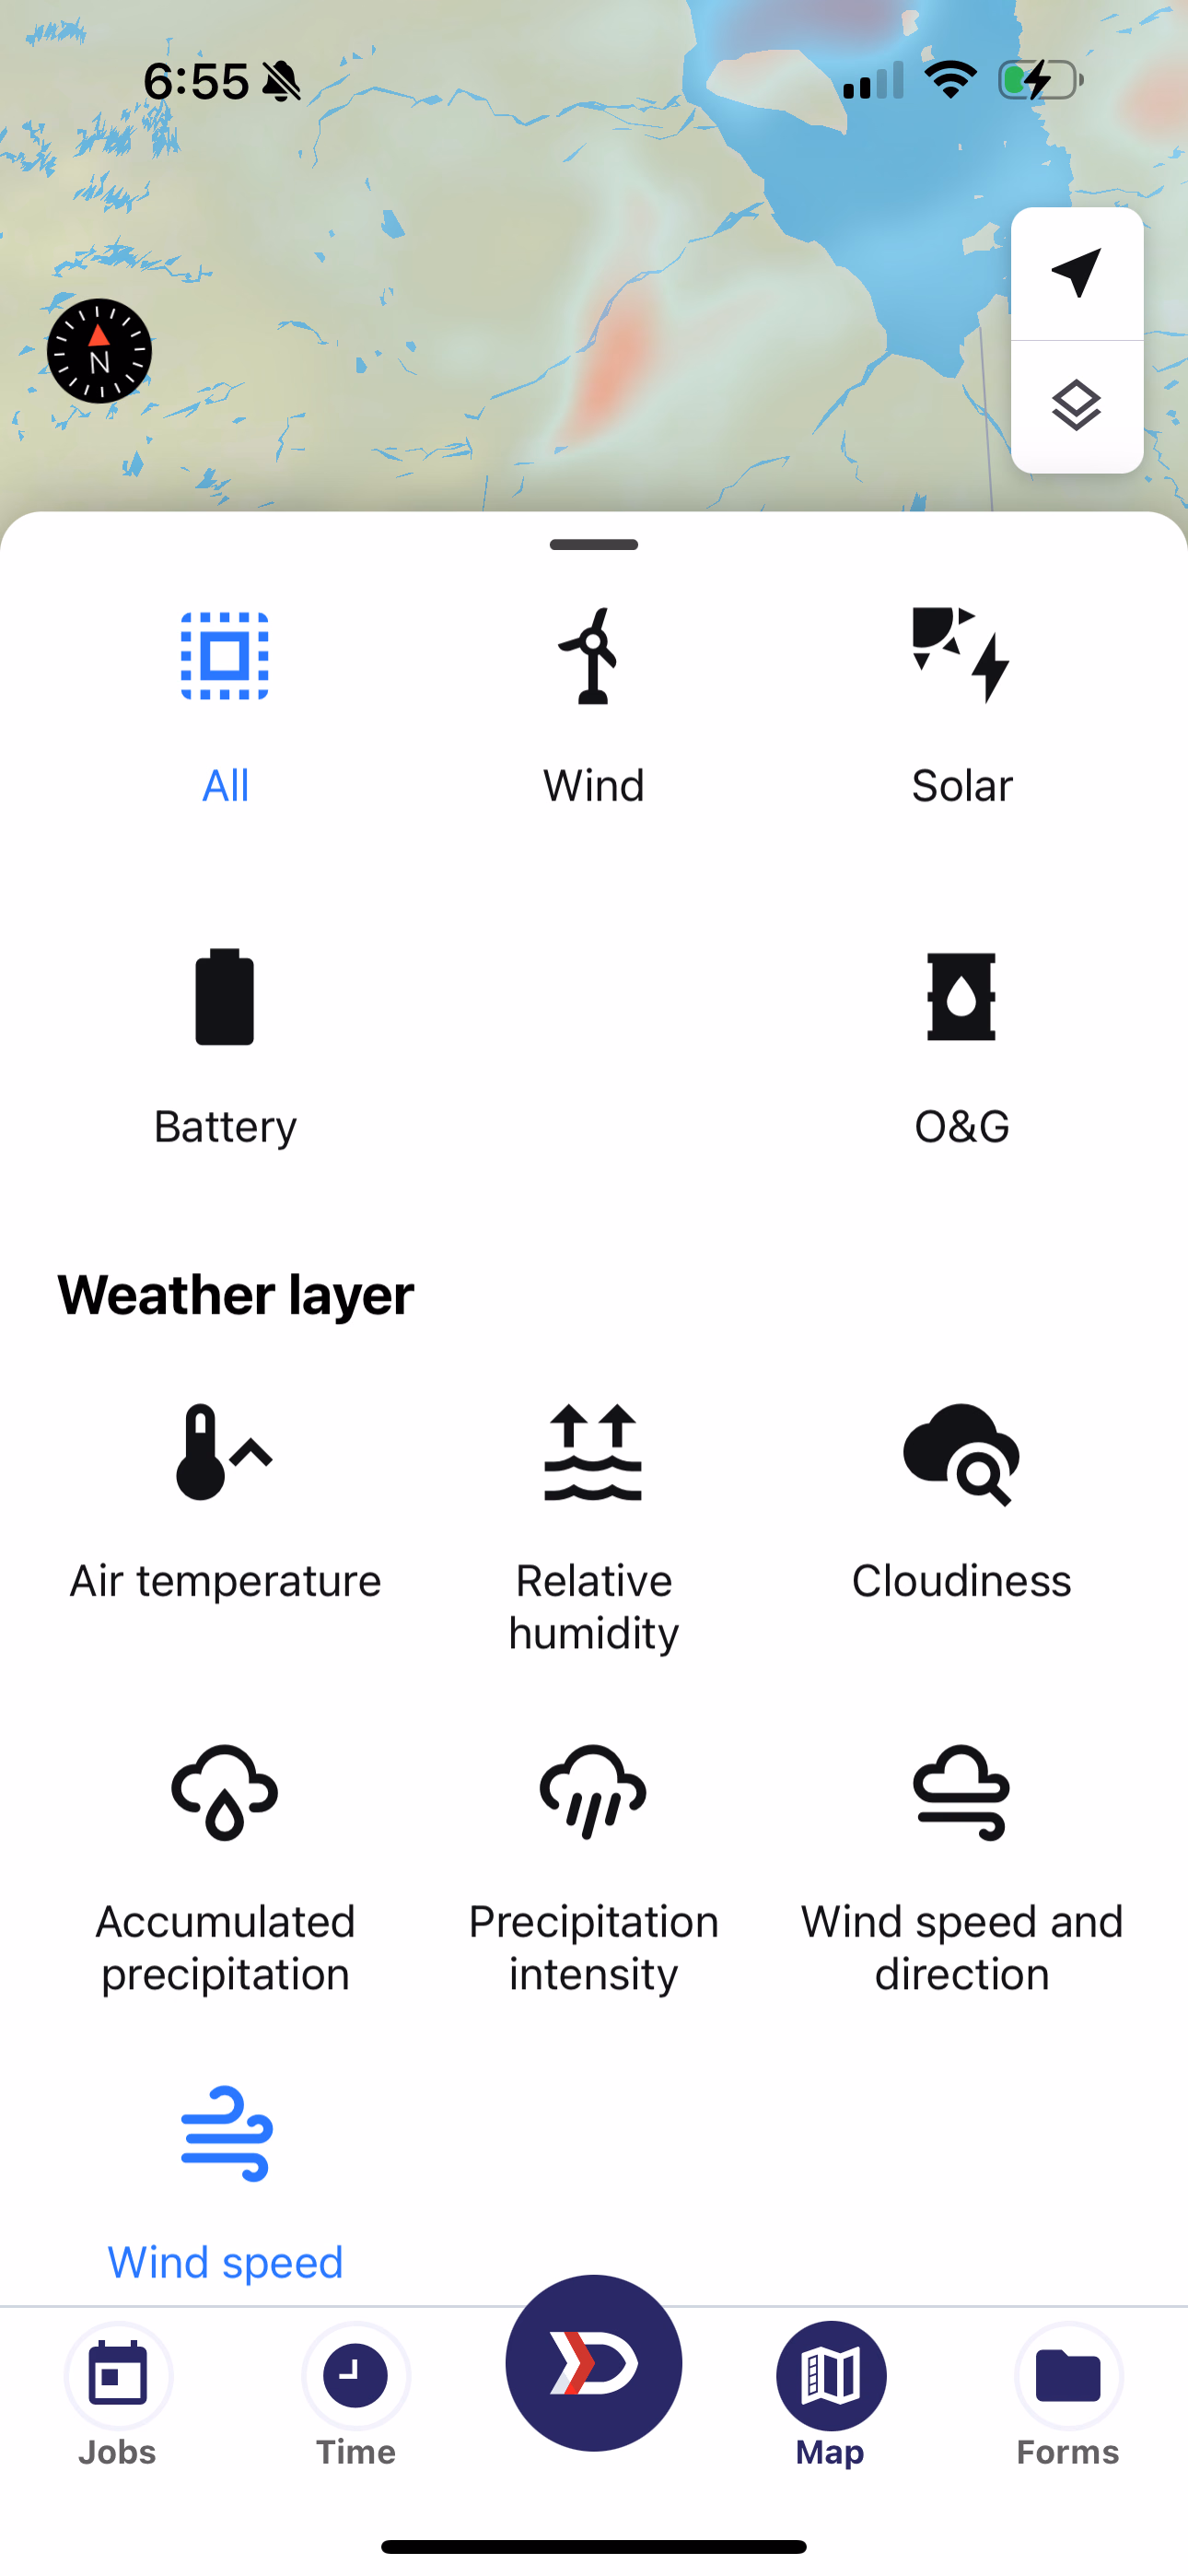
Red indicates wind speeds over 15 m/s